
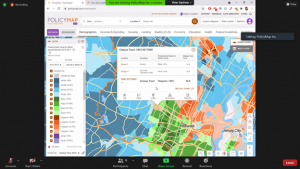
See what’s new in PolicyMap, a GIS mapping tool, which is used at SHU in many programs such as Public Health, Political Science and Education for student assignments and useful data for grant applications. There are fantastic new enhancements to make PolicyMap even more essential in your classroom and for your research including simplified data labels, histograms for ranges, an amazing number of boundaries and custom regions you can create, data benchmarks for context and the ability to add local data to PolicyMap that is important for your research. On June 1, the Libraries held a webinar that looked at new data including predominant race, mortgage denials/redlining, Social Vulnerability Index (CDC), andjh Medically Underserved Areas. The recording of the June 1 webinar is located here. Additional sessions will be scheduled over the summer. Stay tuned to SHU Libraries social media.
 Information about new features is listed below:
- New help page for new PolicyMap: https://policymap.helpdocs.io/
- Data Updates: https://policymap.helpdocs.io/whats-new/data
- Multi-Layer Maps (upgrade to 3-Layers) https://policymap.helpdocs.io/multi-layer-maps/making-a-multi-map
- Editing Custom Regions https://policymap.helpdocs.io/custom-regions/edit-a-custom-region
There are additional resources available with sample assignments about using PolicyMap in the classroom here: https://policymap.helpdocs.io/academic-resources.
Please contact your liaison librarian for more information about PolicyMap.