The 100 Top Science Stories of 2010

Every year Discover magazine lists its 100 Top Science Stories, and a number of these stories, particularly those involving physics and engineering, require a lot of math in their execution. Beyond that, however, four of the stories feature mathematics centrally. In numerical order:

  • In #51 A Computer Rosetta Stone we find a computer program that deciphers ancient heiroglyphics statistically. MIT computer scientist Regina Barzilay has developed the program, which compares unknown letters and words to letters and words of known languages in order to find parallels. When she tested it by seeing how much of ancient Ugaritic the program could decipher using the related language Hebrew as the ‘parallel’, the program correctly matched 29 of the 30 Ugaritic letters to their Hebrew equivalent, and 60% of the Ugaratic words that had Hebrew cognates. More importantly, it did the work in a matter of hours, whereas human translators needed decades (and the chance find of an ancient Ugaritic axe that had the word “axe” carved on it) to accomplish similar feats. While the program certainly cannot replace the intuition and feel for language that human scientists possess, “it is a powerful tool that can aid the human decipherment process,” and could already be of use in expanding the number of languages that machine translators can handle.
  • #60 Fighting Crime with Mathematics details the work of UCLA mathematicians Martin Short and Andrea Bertozzi who, along with UCLA anthropologist Jeff Brantingham, developed a mathematical model of the formation and behavior of crime ‘hotspots.’ After calibrating the model with real-world data, it appears that hotspots come in two varieties: “One type forms when an area experiences a large-scale crime increase, such as when a park is overrun by drug dealers. Another develops when a small number of criminals—say, a pair of burglars—go on a localized crime spree.” According to the work, the typical police reaction of targeting the hotspots appears to work much better on the first type of hotspot, but hotspots of the second type usually just relocate to a less-patrolled area. As the story notes, “By analyzing police reports as they come in, Short hopes to determine which type of hot spot is forming so police can handle it more effectively.”
  • There seems to be a steady stream of stories recently that remark on how some animals instinctively know the best way to do things. One example from this blog is Iain Couzin’s work on animal migration. And here’s another: #92 Sharks Use Math to Hunt. Levy flight is the name given a search pattern which has been long suspected by mathematicians of being one of the most effective hunting strategies when food is scarce. David Sims of the Marine Biological Association of 
the United Kingdom logged the movements of 55 marine animals from 14 different species over 5,700 days, and confirmed that the fish movements closely matched Levy flight. (The marine animals included tuna and marlin, by the way, but sharks always get the headlines.)
  • #95 Rubik’s Cube Decoded covers a story already mentioned on this blog about “God’s Number”, the maximum number of moves that an omniscient being would need in order to solve any starting position of Rubik’s cube. The answer, as you can read in this story or by reading my earlier blog post, is 20.

The whole Top 100 is worth going through as well. It’s remarkable to realize how much and how quickly science is learning in this day and age.


A Physicist Solves the City

Sometime around 2008 or so a tipping point was reached: for the first time, the number of people worldwide living in cities outnumbered the number of people living in rural areas. The ‘urbanification’ of humanity will likely only continue (you can see the United Nations projections here), and so cities—their structure, their qualities, their creation, maintenance, and growth—are becoming increasingly important objects of study.

I’ve already mentioned the NY Times Magazine’s Annual Year in Ideas issue in a previous post. Included in the same issue is a full-fledged article on the work of Geoffrey West, a former physicist at Stanford and the Los Alamos National Laboratory. West has recently turned his attention away from particle physics and toward biological subjects, and done so with effect; as the article notes, one of West’s first forays was “one of the most contentious and influential papers in modern biology” which has garnered over 1500 citations since published.

The mathematical equations that West and his colleagues devised were inspired by the earlier findings of Max Kleiber. In the early 1930s, when Kleiber was a biologist working in the animal-husbandry department at the University of California, Davis, he noticed that the sprawlingly diverse animal kingdom could be characterized by a simple mathematical relationship, in which the metabolic rate of a creature is equal to its mass taken to the three-fourths power. This ubiquitous principle had some significant implications, because it showed that larger species need less energy per pound of flesh than smaller ones. For instance, while an elephant is 10,000 times the size of a guinea pig, it needs only 1,000 times as much energy. Other scientists soon found more than 70 such related laws, defined by what are known as “sublinear” equations. It doesn’t matter what the animal looks like or where it lives or how it evolved — the math almost always works.

West’s next work went along similar lines, but now the biological subject under the microscope was the city. The first and natural quantity to investigate would be something that played the role of ‘energy’ in the city, and West and his collaborator Luis Bettencourt discovered that indeed a whole host of ‘energy’ measures scaled at a sublinear rate.

In city after city, the indicators of urban “metabolism,” like the number of gas stations or the total surface area of roads, showed that when a city doubles in size, it requires an increase in resources of only 85 percent. This straightforward observation has some surprising implications. It suggests, for instance, that modern cities are the real centers of sustainability…. Small communities might look green, but they consume a disproportionate amount of everything.

Still more surprises arrived when West and Bettencourt looked at measuring not ‘energy’ in terms of infrastructure, but ‘energy’ in terms of people. When people decide to move to a city—and as the United Nations data shows, people are doing so in droves—they often do so not to decrease their expenditures, but to increase their social opportunities. Now it is hard to measure social interactions, but there are related interactions that can be measured, and interestingly enough these seem to scale the same way infrastructure does, but in the opposite direction. Social activity seems to scale in a superlinear way. All sorts of economic activities, from city-wide construction spending to individual bank account deposits, increase by 15 percent per capita when a city doubles in size. Or as West puts it, “[y]ou can take the same person, and if you just move them to a city that’s twice as big, then all of a sudden they’ll do 15 percent more of everything that we can measure.” The bad news is that the ‘everything’ is in fact everything: violent crime, traffic, and AIDS cases for example also see the same type of increase.

West and Bettencourt’s current calculations are controversial and not universally believed. (The author, Jonah Lehrer, seems fairly skeptical himself.) Nevertheless, as with the earlier biological findings, the work described here certainly looks like a very good launching point for some very valuable and much needed future analysis.

The 10th Annual Year in Ideas

NY Times 2010 Year In Ideas

Another year has passed, which means it’s time again for the NY Times Magazine’s annual The Year in Ideas issue, “a high-to-low, silly-to-serious selection of ingenuity and innovation from 2010.” As with the 2009 list, a number of these ideas are based around some bit of mathematics and/or statistical analysis. The ones I’ve listed below are the ones that most prominently feature mathematics ideas, or feature mathematics and/or mathematicians centrally.

  • Perfect Parallel Parking by Jascha Hoffman mentions Simon Blackburn’s geometric analysis of parallel parking, which we covered on the blog previously. Updating that earlier story, Hoffman’s entry notes that Jerome White and some fellow teachers at Lusher Charter School in New Orleans subsequently improved the model. (White and company built in allowances for the driver to do a bit more maneuvering.)
  • Aftercrimes visits a topic seen already here in this blog: just as earthquakes typically beget aftershocks, some types of crime beget copycat crimes. Mathematician George Mohler has been able to show that “the timing and location of the crimes can be statistically predicted with a high degree of accuracy.” For more info, check out the entry and the earlier blog post.
  • The entry Social Media as Social Index describes some of the ways that researchers—academic, government, and corporate—are mining social networks like Twitter and Facebook for valuable information. For instance, algorithms analyzing millions of Twitter posts were able to predict how certain movies would perform at the box office and how the Dow Jones Industrial Average would perform in the near future. More social media data mining is undoubtedly in store, as the story ends with one Facebook officer quoted as saying that this is the future of opinion research.
  • Finally, two entries which illustrate the public appetite for data analysis. Do-It-Yourself Macroeconomics describes the growing legion of “ordinary citizens” who are making it their business to “pull apart the [economic] data and come to their own conclusions.” All this is possible, of course, due to the explosion in publicly available economic data, one example of which is described in The Real-Time Inflation Calculator. As the story concludes, thanks to this (freely available) software, “Data on prices, once monopolized by government gatekeepers, are now up for grabs.”

In 500 Billion Words, New Window on Culture

Sciences

Well that was fast. My last post described a project that analyzed word frequency in book titles, and mentioned that Google (which was providing the scanning and compiling for the project) had begun work on scanning and compiling an even larger corpus: the actual texts of every book published from 1500 to 2008. Now from the NY Times comes an article describing some preliminary analysis of the book text data sets. Even the preliminary results, obtained after only 11% of the task has been completed, are amazing.

[T]he researchers measured the endurance of fame, finding that written references to celebrities faded twice as quickly in the mid-20th century as they did in the early 19th. “In the future everyone will be famous for 7.5 minutes,” they write.

Looking at inventions, they found technological advances took, on average, 66 years to be adopted by the larger culture in the early 1800s and only 27 years between 1880 and 1920.

They tracked the way eccentric English verbs that did not add “ed” at the end for past tense (i.e., “learnt”) evolved to conform to the common pattern (“learned”). They figured that the English lexicon has grown by 70 percent to more than a million words in the last 50 years and they demonstrated how dictionaries could be updated more rapidly by pinpointing newly popular words and obsolete ones.

Other surprising and interesting facts mentioned include the relative frequencies of the words “men” and “women”, the popularity of Jimmy Carter, the rise of grilling, and the many more instances of the words “Tiananmen Square” in English-language texts than in Chinese-language texts.

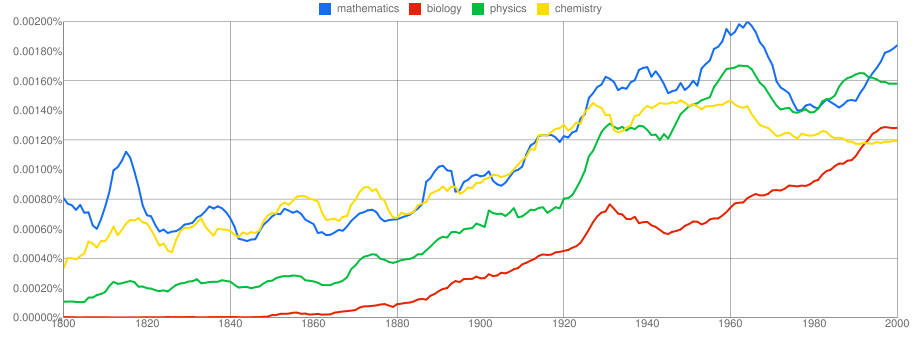
And there’s more! Google has created a web tool that lets anybody plot the popularity of words and phrases over time. In the picture heading this entry I charted the relative frequencies for the words “mathematics,” “biology”, “physics”, and “chemistry” for the years 1800–2000. I was a bit surprised (but not unhappy) to see mathematics leading the pack at the moment, but the thing that is most obvious is the general trend: people are just getting more and more interested in the sciences as time goes by. The article and the Google tool also mention that the data sets themselves are available for download for those who have more heavy-duty data analysis in mind.

The research is detailed in a recent article from Science, which has taken the unusual step of making the article freely available. (That’s what the Times article says. It looks to me like you do have to sign up for a free Science registration.) Fourteen entities collaborated on the project; I use the word ‘entities’ because one author is listed as “The Google Books Team.” The two main authors, Jean-Baptiste Michel and Erez Lieberman Aiden, both have backgrounds in applied mathematics, as do some of the other listed authors.

As with the previous work on title words, the reaction of humanities scholars to the appearance of statistics and data analysis in their domain has been mixed. But there seems to be little doubt that, as the article states, this data set itself “offers a tantalizing taste of the rich buffet of research opportunities now open to literature, history and other liberal arts professors who may have previously avoided quantitative analysis.”

Analyzing Literature by Words and Numbers

Christian data

The first paragraphs of newspaper articles typically aim to summarize the main points of the full article, and the first paragraph of this NY Times article by Patricia Cohen does a whiz-bang job.

Victorians were enamored of the new science of statistics, so it seems fitting that these pioneering data hounds are now the subject of an unusual experiment in statistical analysis. The titles of every British book published in English in and around the 19th century — 1,681,161, to be exact — are being electronically scoured for key words and phrases that might offer fresh insight into the minds of the Victorians.

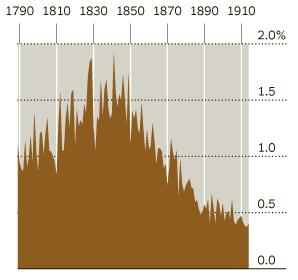
The data comes from a project of Dan Cohen and Fred Gibbs, Victorian scholars at George Mason University, with a big assist from Google, which is funding the project and carrying out the scanning and compiling. Although only the titles of the books have been compiled to date, even they reveal some interesting trends. The image above is one of a few graphs generated by the Times from the title data, and shows a big decline in the appearances of the word “Christian” in titles as the 19th century progressed. Other graphs show big decreases in the use of “universal”, and increases in the instances of the words “industrial” and “science”.

The entire corpus—the text of the books as well as the titles—should be compiled soon, at which point more sophisticated analyses can be performed. The quoted reactions of Victorian scholars toward the appearance of statistical tools in their milieu vary from “sheer exhilaration” to “excited and terrified”. But one common reaction to the analysis seems pervasive, and was best expressed by Matthew Bevis, a lecturer at the University of York in Britain: “This is not just a tool; this is actually shaping the kind of questions someone in literature might even ask.”

Popular Science’s Brilliant 10

Each year the magazine Popular Science dubs 10 young scientists their “Brilliant 10”, highlighting the scientists’ work and its implications. In the 2010 edition, more than a few of the profiled rely on mathematics. The work of two, Iain Couzin and Paul Rabadan, are especially mathematical and I’ll mention them here.

Iain Couzin, “the Pattern Maker”, works in ecology and biology, and specializes in identifying the rules that underlie the movements of groups of animals.

The shuffle of life—the wheeling of birds, the silver flash of escaping fish—looks mystically organized. Iain Couzin, who models collective behavior in nature, identifies those patterns mathematically. And he’s finding that certain patterns extend across otherwise unrelated units of life, whether bugs or cancer cells.

This is, of course, one of the great strengths of mathematics: once abstracted, it is easy to recognize a pattern that occurs in different places. Some of Couzin’s earlier work—featured in articles in National Geographic and the NY Times, for instance—involved divining the rules that army ant colonies use to direct their devastating raids. His most recent work, mentioned in Discover, provides an explanation for the large migrations seen in so many animal species. The model, if correct, also provides a warning: tampering with the migrating herds, through hunting or habitat alteration, could devastate the migration instinct itself.

Migration could disappear in a few generations, and take many more to come back, if at all. Indeed, bison in North America no longer seem able to migrate, a fate that may soon be shared by wildebeest in the Serengeti. Migration may vanish at a scale measured in human years, and recover at time scales measured in planetary cycles.

Raul Rabadan, “the Outbreak Sleuth” has a background in string theory, but his numerical experience is serving him well now in his hunt for the agents behind various biological diseases.

Raul Rabadan hunts deadly viruses, but he has no need for biohazard suits. His work does not bring him to far-flung jungles. He’s neither medical doctor nor epidemiologist. He’s a theoretical physicist with expertise in string theory and black holes, and he cracks microbial mysteries in much the same way he once tried to decode the secrets of the universe: He follows the numbers.

Rabadan has been a pioneer of a data analysis technique called Frequency Analysis of Sequence Data that has been able to pinpoint previously unknown viruses as the cause of major disease outbreaks in various animal (and human) populations. Some of his work focused on tracing the origins of the H1N1 swine flu virus, with articles about the work appearing in Wired and online at CNN and USA Today.

Proofiness

Stephen Colbert coined the word ‘truthiness’ on the very first episode of The Colbert Report, in an attempt to describe statements that have that truthful flavor about them, but without any actual truthful content. The word caught on and entered the lexicon, and the most recent NY Times Magazine On Language column looks back at its five-year history and the “Colbert suffix” that has now come to indicate that ersatz feeling.

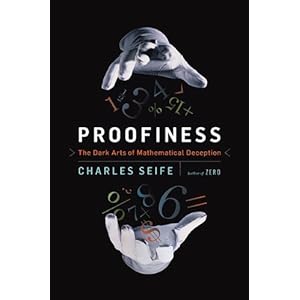
Mentioned as an example of the suffix’s spread is Charles Seife’s latest book Proofiness: The Dark Arts of Mathematical Deception. Seife’s book is a look at “the idea that you can use the language of mathematics to convince people something is true even when it is not.” The book is chock full of various people—primarily but not always political people—tinging their speeches, statements, and arguments with ‘mathiness’ in order to make their positions seem to have a factuality and solidity that isn’t really there. The book is getting very good reviews, from the Washington Post, NPR, and the NY Times, for instance. Interviews with Seife can be found here and here, and a brief excerpt appears here.

Mathematics and Futbol


Soccer has long been one of the team sports with the least amount of statistics, especially statistics on individual players. Unlike (American) football or baseball, say, there are no regular stops in play that break the game into easily digestible chunks; and unlike basketball, say, the ‘important events’ in soccer—like goals, saves, or shots on goal—are relatively rare, and don’t necessarily reveal which team or players are doing well.

Now Luis Amaral and Josh Waitzman from Northwestern University are bridging that gap using, of all things, the mathematics behind social networks. By treating each pass between players as a “link” it is possible to then measure which players are most “central” to the network created and thus, whose presence most helps the team go. Their new metric appears to correlate fairly well with the soccer establishment’s subjective opinions. Is fantasy soccer around the corner? The story was picked up by a number of news outlets, including the Washington Post, Scientific American, and UPI, as well as the online arms of the Discovery Channel and Sports Illustrated. Amaral and Waitzman’s original paper can be found here.

Addendum: A network approach using passing data was also employed by Javier López Peña and Hugo Touchette from Queen Mary University during the 2010 World Cup to analyze teams’ strategies and predict match winners. According to the article “Mathematical Formula Predicts Clear Favorite for the FIFA World Cup” at ScienceDaily, the network predictions’ accuracy rivaled that of the psychic octopus that caught the eye of the news. Dr. Peña was interviewed on CNN Espanol about the mathematical (non-cephalopod) prediction method.

World Series of Poker: Attack of the Math Brats


The time we live in has been called The Information Age by some because of the mountains of data that have become available. Often, analyzing that data can end up revealing better ways to do things, or even completely overturn traditional wisdom in favor of new techniques, techniques that are actually backed up by data evidence. (Super Crunchers was a recent book about this very trend.) As this Time magazine article relates, this phenomenon is happening very quickly and very publicly in the high-stakes world of Texas hold’ em poker. The old guard, whose play is based in part on “reading” their opponents, is being overwhelmed by young players armed with probability-based strategies, strategies divined by analyzing reams of data obtained from the millions of online poker games played on the internet. The article leads off with a quote from old-guarder Phil Hellmuth, who’s won a record 11 World Series of Poker championship bracelets:

“The reason I won 11 bracelets is my ability to read opponents,” he explains. “These new guys are focused on the math. And they are changing everything.”

The old guard is not going out without a fight, of course. Many of them are picking up the new techniques and trying to meld them with their own expertise. But the new ‘math brats’ are setting the pace: 21-year-old Joe Cada won last year’s Poker Main event, netting $9 million and becoming its youngest winner ever. The previous youngest winner was 22-year-old Peter Eastgate, who won in 2008. The youngest winner before that was Hellmuth, and he’d held that record for nearly 20 years.

The Ninth Annual Year in Ideas

2009 Year In Ideas

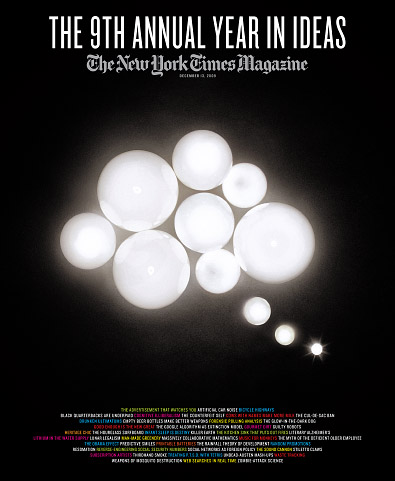
The NY Times Magazine annually publishes its The Year in Ideas issue, devoted entirely to “the most clever, important, silly and just plain weird innovations … from all corners of the thinking world.” A surprising number of these ideas are based on a study or research article or something similar that employs some bit of mathematical and/or statistical analysis. The ones I’ve listed below are chosen as being the ones that most prominently feature mathematics ideas, or feature mathematics and/or mathematicians centrally. Listed alphabetically:

  • Black Quarterbacks Are Underpaid by Jason Zengerle describes the statistical analysis of two economists, David J. Berri and Rob Simmons, who discovered that in the NFL black quarterbacks are typically paid much less than white quarterbacks. Their analysis goes farther, however, and notes that the apparent cause is not necessarily racism. Instead, the NFL quarterback rating statistic is the culprit. NFL contracts are often based on hitting certain statistical levels, and for quarterbacks the statistic used is often the QB rating. Since QB rating fails to count rushing yards at all–something that black quarterbacks typically excel at–black quarterbacks are typically ‘discounted’, QB rating-wise.
  • Forensic Polling Analysis visits a topic seen already here in this blog: the suspicious polling numbers of the polling firm Strategic Vision LLC. You can visit that entry or the Times article for more info.
  • In a blow to meritocracy-lovers everywhere, another entry notes that Random Promotions, rather than merit-based ones, can actually produce better businesses (and typically do, at least in simulations). The article by Clive Thompson describes a study done by a trio of Italian scientists in which the researchers created a virtual 160-person company and then tried out various different promotion schemes within the company, with the aim of seeing which scheme improved the company’s productivity the most. Promoting on merit turned out to be a lousy idea (at least for the company as a whole) while promoting at random turned out to be the top strategy. In the middle was the curious idea of alternately promoting the best and then the worst employees. The fact that the mixed best/worst strategy outperformed the merit strategy is yet another example of Parrando’s Paradox, a phenomenon first identified by game theory.
  • Massively Collaborative Mathematics features the first mathematical theorem proved by a ‘collective mind’, if you will. In January 2009, Timothy Gowers, one of the top mathematicians in the field, proposed on his blog that the mathematical community, as a whole–or at least that portion that knew and read his blog–attack a long-standing unsolved problem in mathematics known as the Density Hales-Jewett Theorem. Contributors ranged from eminent mathematicians to high school teachers, and hundreds of thousands of words worth of ideas were eventually proposed, developed, discarded, combined, and so forth. Gowers had initially set the bar low, hoping this ‘Polymath’ project would result in “anything that could count as genuine progress toward an understanding of the problem.” Instead, six weeks later the problem was completely solved. A paper detailing the result, authored by D.H.J. Polymath, has been submitted to a leading journal.
  • Finally, the (alphabetically) last idea listed, “Zombie-Attack Science,” features a story that appeared on this blog previously. See that entry, or the Times article, of course, for details.