Exploring Germanic Languages through Glottolog

I explored three different languages while testing out Glottolog: German, Swedish, and Norwegian. I knew already that all three of these languages were related in some way already. Before, I had believed that Norwegian and Swedish were close “siblings” to each other and more distant “cousins” to German. During my exploration, I designed a “family tree” of the three languages relative to each other as well as to English. One thing I discovered was that, despite how similar Swedish and Norwegian are to each other in vocabulary and grammar, they are more removed from each other than I thought. Norwegian’s “grandparent,” North Germanic, is actually Swedish’s “great-great grandparent,” making Norwegian Swedish’s 1st cousin twice removed. I was also interested in seeing how closely German and Norwegian were related. I found German and Norwegian both branch off from West Scandinavian. However, West Scandinavian is German’s “great-great-great-great grandparent” while only Norwegian’s “parent.” I found it interesting how German went through the most branching-off of all the languages I explored, while Norwegian went through the least. Finally, I explored German versus English, since I knew they also have very similar vocabulary and grammar. I discovered the closest relation they have together is Northwest Germanic, their “great-great-great-great-great-great grandparent,” making these two languages distant, 7th cousins to each other.

More on Index Card Vs. Online Data

The 2017 online data set seemed to demonstrate that people knew more languages than the 2016 index card set. This may be directly related to the ability of people to have time to think and list the additional languages they were familiar with.The setting, the timing, and the ability to enter more languages (there may have been less room to fill in these details on index cards) could have impacted these results, enabling people to realize that they were familiar with more languages than they might have initially thought. The presence of an interviewer while filling out the questionnaire may also have affected the results, as some might have been influenced to fill out more languages (possibly to please the interviewer) or have the ability to ask questions of the interviewer (and therefore enter more languages).


In addition, the way in which people were referred to the questionnaire may also have affected the results. For example, if people were referred to the study, there may have been a bias of including those (such as those interested in linguistic anthropology) who had interests in languages, those who already knew a lot of languages, or those who were being exposed to the languages, perhaps from their peers/friend groups. In addition, the particular mix of students being admitted to Seton Hall each year (perhaps some years were more diverse), may also have been reflected in the 2017 online data.

Index Card Data vs. Online Data

Hello! Recently I have been looking at the 2016 index card data and the 2017 online data on the Language Maps and Language Clouds blog. While comparing the data from the two posts I realized that there are benefits and drawbacks to each set. The 2016 index card data has a larger focus on the proficiency of the language. It also gives insight into what context the language may have been used in, which can be insightful when mapping the origins of the language. The 2017 online data has a larger focus on the residences and how the participants heard about that language.

However, the 2016 index card data set does not go into depth about the region: where they may have picked up on the language. On the other hand, the 2017 online data set does not have a quantifiable way to measure how proficient a person is in that language. They merely wrote a bit about the language. I personally prefer the 2016 index card data set. It gives insight into region, proficiency, and context in an organized and quantifiable manner. Furthermore, I noticed that most of the languages in the data were English, Spanish, French, German, and Italian. It made me wonder if the abundance of these languages is caused by the fact that all these languages are taught in high schools in the United States or if there is a higher density of people in this area originating from the countries that speak those languages. It is something that could be investigated in the future.

Listen in – Q&A with US Census specialist

Here we are, deep in the year of the COVID pandemic that changes a lot of our speech interactions. As I write this is July 2020, the opportunity to work on existing data becomes a welcome gift. Here are archived clips from our chat with David Kraiker that surprisingly continue to be relevant, starting with a question from Monet.
Monet asked David how he got started at the Census Bureau (2:48):
Adam asks about the future of language data and the American Community Survey or ACS  including our favorite Census Data table B16001 (1:52):
Cece asks about the citizenship question in the 2020 Census as well as the ACS; David discusses at length how the Census aggregates data in order to protect privacy (2:53):

How important is rote memory?

When it comes to language, there are many distinct levels of proficiency, ranging from being able to identify a language you overhear to being able to speak it fluently. Having these distinctions is important because it lets us collect data that we can use to get a general sense of a what languages people speak in a sample and see how they gauge their proficiency and if it falls under the same category as ours. However, it is often difficult to see where a person falls on the spectrum. Read more

Youtubers and random Numbers in Excel

In order to properly assign random identification numbers to those who contributed specific sets of data. I truly wanted randomly computer-generated numbers not just a 1-10 count. However, I did not know how to ask Excel to do this for me, so I consulted the internet. I googled “randomly generated numbers excel” and got a few promising articles and set to work learning. One of the best videos I found was from a youtuber known as Doug H. who specializes in excel and its functions, he is amazing! What most of the articles asked was to use the (=RAND) command which I found worked perfectly to generate a single random number, however I needed a lot more. Since the function needed a number minimum and maximum, I went with the classic 1-100; (=RANDBETWEEN(1,100)).

Read more

Census Changes in 2020: What to Expect

Previously in Linguistic Anthropology for Fall 2017, my fellow students and I learned about the US Census and had David Kraiker, a Data Dissemination and GIS Specialist from the Census, talk to the class about what the organization does. As 2020 is fast-approaching, so does the new census to be given out to people residing in the United States. Every decade since it’s inception, the U.S. Census Bureau formulates a new questionnaire for people to answer. The purpose is to collect accurate demographic information and data that can be beneficial for policy making and record keeping. Data collected is publicly available and informs everything from the building of new schools to managing hospitals. As noted in recent news reports and blogs, they have also been used electorally to gerrymander districts. The important and daunting task of data collecting has a wide-reaching impact; what kinds of concerns are raised then when changes are made to the questions asked? A widely reported and controversial change is the addition of a question pertaining to participants’  citizenship statusThe addition of the citizenship question for 2020 is now very likely as the Supreme Court is poised to allow the question into the survey.

Read more

Interview with David Kraiker, US Census Data Specialist

On 3 December 2018 the Language Maps, Language Clouds team had the opportunity to interview David Kraiker of the US Census Bureau who has visited our classroom in the past to share free ways to use ACS language-related data. Below is an overview of the conversation; boldface sections summarize the LMLC team’s questions. To listen to the audio files, click here.

What made you want to work for the Census? David started working at the US Census Bureau after a stint at a map publishing company. He was attracted by better compensation, but he continues to work for the Census Bureau because he is able to help with encouraging the use of data in the hope of improving society. “What makes me want to work for the Census Bureau…I do more for society in this job than I did when I was creating atlases. People are using the data that we have, I hope for good purposes and it’s a way of improving society”.

Read more

English: A Global Language

One of the concepts learned in Linguistic Anthropology Fall 2017 was the idea of a global language which is a language spoken by many people across the world as it holds a significant weight to it in government, education, or other social areas. Currently, the global language is English, more specifically, American English, with hundreds of millions of speakers. It’s not surprising as English is a common means of communication in business and scientific journals but how did it become a global language?

A mini history lesson needs to be said here as British English was the global language for a while. The phrase “The empire on which the sun never sets” was absolutely true given the colonial reach of the British Empire on every continent. Such a global presence and vast amount of resources meant that they were not only a military power but a social power too. Through their own policies they instituted mandatory teaching of English in some parts of the Empire. Since they were also a regional power, people were in a way coerced to learn the language of those who were dominating them.

Read more

Language Death & Dead Languages

In one of our textbooks for Linguistic Anthropology, Language in Society, the author Suzanne Romaine dedicates a part of chapter 2 in exploring the topic of language death. Language death occurs when a language ceases to be spoken and used by people, rendering it non-existent in terms of communication between others.

Language death is a scary concept as it can really happen to any language. What causes this to happen has been debate by linguists, from minority communities being suppressed and overridden by majority force in society, to a phenomenon called “language shift” where a community starts off as bilingual but gradually loses their native tongue.

Read more

Language of the Powerful

One of the most fascinating concepts learned in Linguistic Anthropology Fall 2017 is that of the language of the powerful and the powerless. Powerful language is characterized by being more active, assertive, and commanding while powerless language is more hesitating, unsure, and can be characterized by self-doubting. To give an example, a powerful statement would be “Let’s go to Chili’s this Tuesday” while a statement marked by powerlessness can be characterized as “Uh I guess I’m in the mood for Chili’s but I wouldn’t mind going somewhere else, what do you think?”. Notice the difference? The first sentence is more of a “I will” while the second is more doubtful but it also relates to the way it’s uttered. Tone is all too important, while going over the question part of the statement, did you imagine it being spoken in a higher tone with an unsure inflection? Those are points to be mindful of when detecting whether a person is speaking with a powerful or powerless speech.

Read more

Data & Excel

Data is fun! Excel is a friend with wonderful shortcuts! Those words have been rarely if ever uttered in the English language but it’s actually true in a way. As the merits and cons of using Excel has been reported before in the blog, I figured it is good to carry on that tradition. Working with self-reported data in this study is an experience that I can ever forget and I believe I can say the same for my fellow student researchers’. The data that we worked with provides insight into how people come into contact with various languages through their life experiences. It’s intimate in its own way as you really get to see and understand people’s lives and shared stories.

But then comes the transcribing and coding part of research which is an interesting ride on its own. You see, Excel, our primary mode of transferring the data on flashcards, is a very handy tool but we had to make sure that ALL the data was copied over. Read more

Limitless Language

One of the great advantages of being a part of this research is learning the amount of languages a person knows, understands, speaks, or just able to identify. You learn that your classmates are bilingual, trilingual, or even quadrilingual! The knowledge of being able to communicate in more than one language is a fascinating subject for linguists and was discussed heavily in our Anthropology class. Indeed, this whole research is based on delving into this area and obtaining more information about it.

People who are bilingual though, or others who know more than two languages, aren’t as uncommon as one expects, especially considering a person’s geographical location. The interesting part about gathering data from Seton Hall students is that the campus comprises a mixed ethnic/racial population with students coming from diverse backgrounds. Information on this shows a range of about 45%50% of students identifying as belonging to non-white minority backgrounds! So to discover that the majority of data collected indicates that students are overwhelmingly versed in more than one language is astounding, especially given students understanding languages that aren’t as well-known as others, such as Uzbek as documented from one student.

Read more

Chomsky vs Skinner: A Battle for Language (Pt. 1)

The field of linguistics has had many different perspectives on the topic of language based on a time period’s available evidence. As it was taught in Linguistic Anthropology, this field went through many viewpoints, such as evolving from historical linguistics to descriptive linguistics.

Our knowledge of linguistics keeps evolving with time and accurate evidence. Nothing can be a more apt example of this then the debate over how language forms between two great scientists, B.F. Skinner and Noam Chomsky. To start off with, Skinner is more widely known in the field of Psychology as one of the pioneers of Behaviorism but as mentioned previously,  he also theorized about language development.  He spoke on how children learn language from the environment around them, mainly in a behaviorist framework. Basically, as a child learns new language skills, social influences will use reinforcement to help their learning move along, such as a child saying the word “book” and their teacher nods and rewards them for saying the right word and identifying the right object being focused on.

Read more

Qualitative Research: Challenges We Encounter

One of the biggest challenges in working with qualitative data such as the very self-directed and open ended responses that our participants provided, is interpreting said statements in a way that generates useful data. I have come to observe that in this particular study, the relatively vague direction prompt that was used when administering the survey (something to the effect of “make a statement about each language that you’re aware of”) yielded responses that were either very informative or very (very) vague. Because we asked participants to hand write their responses on index cards, as opposed to having someone else interview and record their answers, or having them use a digital answer form (like the one found elsewhere on this blog), we also had to contend with some instances of unclear or illegible handwriting. Though deciphering somebody’s handwriting ranks relatively low on the scale of challenges that crop up with qualitative research, it can be nonetheless frustrating.  Card (3)41A, "English"Card (3)41B, illegible

Read more

Where the Blog is at the Moment


The picture of my desk above illustrates the main issue that we had for the blog during the summer of 2017.

When we all met for our summer meeting, the main problem we had was that we either couldn’t access our Google Drive to get our information or couldn’t connect to the wifi. So to get around not being able to connect to the wifi, Laura suggested that she could get the data from her laptop since Prof. Quizon couldn’t access the drive. However, another problem came up. The laptops we use for this blog is either our personal computers or the laptops the school provides. To log into the laptop the school provides, you need to log into your student email and to do that, you need to have wifi access. But for some odd reason, Laura’s laptop could not recognize the campus wifi.

After finally being able to connect to the wifi and getting all the data we needed, we all discussed issues that came up at that point.

One of the main issues, besides connecting to the internet and getting our data, was how to code some of our data into the excel because all our data was qualitative data. What we decided to do and how we did in detail it is on a different post but it all came down to figuring out how to categorize something into something else.

The second issue, which is something more personal to me than what it is for the others, is how being an alumni affects the productivity of the blog and internship. One of the main issues is just getting onto the blog because we all use our student emails to log in. Not being a student anymore complicates things. The quick fix was to switch to my personal email and then relinquish admin rights after I hand over to the next group.

The final issue touches the first issue but in more detail. It had to do with how to categorize something that doesn’t have a category. For example, how would you categorize learning a language from a hymn or song? Would you say the person can speak and recognize it but not understand it? This issue was brought up by Stephen when he realized that some students who took the survey said they can sing and recognize a language but not actually read or understand it.

The easiest and fastest way we decided to address this problem is just to make a special category for these cases since it only affected about five or six entires. After going through all our issues and trying to figure out a way around them, we all had pizza and left to enjoy the July weather.

A Relative of ‘Siri’: The Voder

Image result for the voderImage result

While commuting between New York and New Jersey one evening, I tuned into the radio station 93.9 NYC as they started a technology portion of the show. The theme was language, and the first story was on using an translating app to navigate China (linked below), and the second was on this odd contraption called ‘the Voder’. Introduced at the 1939 World’s Fair, ‘The Voder’ was created by Homer Dudley and produced by the Bell Telephone Laboratory. This machine synthesized the first electrical human speech by producing the acoustic components of our speech. A woman ‘works’ the machine almost like a piano to control the various components of the Voder that allows it to ‘talk’. It  even sings “Auld Lang Syne” (a song that many of us today can’t even sing the lyrics to), which I find amazing, but at the same time creepy. Although this technology may seem dated compared to our ‘Siri’ and apps that can produce electronic language so fluidly and accurately, this was an important and interesting step forward in the realm of artificial language production. I wonder what amazing things we will invent today that will improve the communication and interaction of (or completely frighten) our children.

Listen to the story on ‘The Voder’ Here: http://www.wnyc.org/story/the-voder-the-first-machine-to-produce-human-speech/

Translation in Apps Story: http://www.wnyc.org/story/finding-a-pedicure-in-china-using-cutting-edge-translation-apps

Photo taken from : https://120years.net/the-voder-vocoderhomer-dudleyusa1940/


My Opinion: The Best and Worst Functions of Excel for this Project

spirited-away-successs

When creating our database, we had to input a large amount of information into each column for each index card. In this, I love the simple yet amazing ability to freeze the first row of the spreadsheet. Of course, the same can be done for columns.Whether we were on index card 2, 20, or 120, we could clearly see the column title of what type of information we were inputting.

Another function of excel that was awesome was the use of pivot tables. Pivot tables allowed us to quickly sort and count our data to give us an idea of  what our data would look like once uploaded for data visualization. For instance, with a pivot table we could see how many speakers were attributed to each language. We could also see who input what data, and sort by what type of information. For example, if one of the team member had clacked on my name, they could see how many cards I input were English. However, we decided not to keep it as part of our data set as the external visualization program we used allowed us to see the same information when we uploaded our data, even allowing clickable charts, maps, etc.

A final function that was greatly appreciated was the ability of an Excel spreadsheet to be uploaded onto Google drive, shared, then downloaded as an Excel file. This helped greatly, as the team felt most comfortable with Excel over the Google spreadsheet. Though I’m not sure if this should be attributed to Google or Microsoft (or both), this was none the less a great function.

But with the best, also comes the worst…

spirited-away-stairs-gif

The biggest problem for me when starting this project was using qualitative data as opposed to quantitative data. When I had previously learned how to use an earlier version of Microsoft Excel early in high school, we worked with quantitative data and functions. In that, I found it a bit challenging in the beginning to just be putting in names and words instead of mathematical problems and functions.  However, I was surprised to find that when working in a column, excel will pop up with a cell fill-in for a word previously used. So say I was typing in the last name ‘Smith’ for a second or fifth time, I would have only typed up to the ‘m’ and excel would suggest “Smith” to put into the cell.

excel-fill-in-part-2

Where this turns sour for me is that if you skip a cell down and start typing into the second cell underneath, it no longer has the fill in as an option. I REALLY wish that this carried over while in the same column. When it came to really long or odd names, I really wished that excel would still automatically suggest a word fill in, even when you skip the cell of the next row. excel-fill-in-part-3

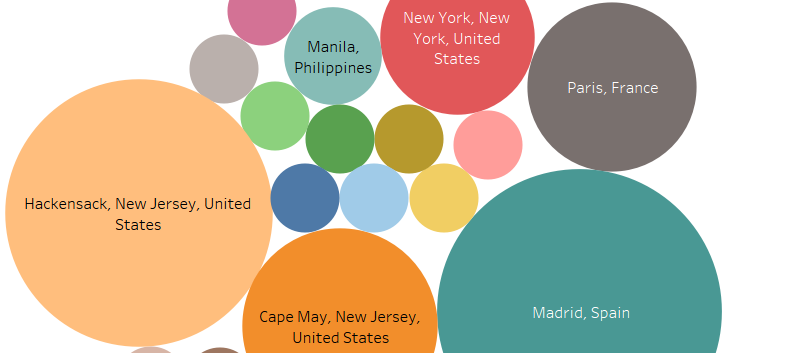
When trying to visualize our data, we ran into a problem. Where we had input  just countries or regions (i.e. Atlantic Midland, Inland North, etc.) as the language’s origin, the visualization technology we were using could not figure out how to map the languages with just the country. In that, we had to go back and put in the capital of each country of the languages origin, and designate a ‘capital’ for different types of English (i.e. North Jersey vs. South Jersey English), which resulted in a more accurate depiction of the locations of each language origin. Overall, I wish that Microsoft Excel would improve on it’s compatibility with other software and websites. Though I understand there’s much time, thought, and agreement that needs to be done for this, companies like Amazon and Paypal work with other websites and services to create a smoother use of services. Therefore, Microsoft does have the ability to work better with other companies’ programs, and I wish that both parties would work to do so in the near future.


Both of the above images do not belong to me. ‘Spirited Away’ is the property of Studio Ghibli/Disney and were found here: giphy.com/search/spirited-away-gif