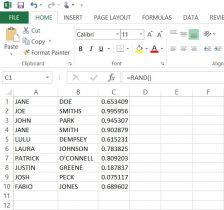

When creating our database, we had to input a large amount of information into each column for each index card. In this, I love the simple yet amazing ability to freeze the first row of the spreadsheet. Of course, the same can be done for columns.Whether we were on index card 2, 20, or 120, we could clearly see the column title of what type of information we were inputting.
Another function of excel that was awesome was the use of pivot tables. Pivot tables allowed us to quickly sort and count our data to give us an idea of what our data would look like once uploaded for data visualization. For instance, with a pivot table we could see how many speakers were attributed to each language. We could also see who input what data, and sort by what type of information. For example, if one of the team member had clacked on my name, they could see how many cards I input were English. However, we decided not to keep it as part of our data set as the external visualization program we used allowed us to see the same information when we uploaded our data, even allowing clickable charts, maps, etc.
A final function that was greatly appreciated was the ability of an Excel spreadsheet to be uploaded onto Google drive, shared, then downloaded as an Excel file. This helped greatly, as the team felt most comfortable with Excel over the Google spreadsheet. Though I’m not sure if this should be attributed to Google or Microsoft (or both), this was none the less a great function.
But with the best, also comes the worst…

The biggest problem for me when starting this project was using qualitative data as opposed to quantitative data. When I had previously learned how to use an earlier version of Microsoft Excel early in high school, we worked with quantitative data and functions. In that, I found it a bit challenging in the beginning to just be putting in names and words instead of mathematical problems and functions. However, I was surprised to find that when working in a column, excel will pop up with a cell fill-in for a word previously used. So say I was typing in the last name ‘Smith’ for a second or fifth time, I would have only typed up to the ‘m’ and excel would suggest “Smith” to put into the cell.

Where this turns sour for me is that if you skip a cell down and start typing into the second cell underneath, it no longer has the fill in as an option. I REALLY wish that this carried over while in the same column. When it came to really long or odd names, I really wished that excel would still automatically suggest a word fill in, even when you skip the cell of the next row. 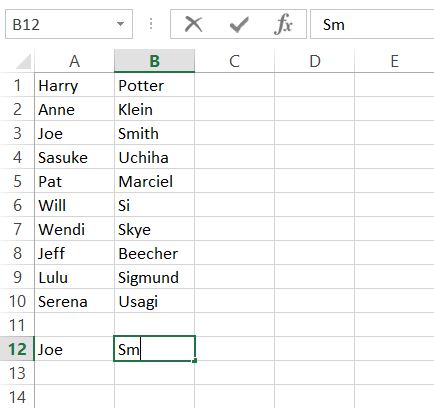
When trying to visualize our data, we ran into a problem. Where we had input just countries or regions (i.e. Atlantic Midland, Inland North, etc.) as the language’s origin, the visualization technology we were using could not figure out how to map the languages with just the country. In that, we had to go back and put in the capital of each country of the languages origin, and designate a ‘capital’ for different types of English (i.e. North Jersey vs. South Jersey English), which resulted in a more accurate depiction of the locations of each language origin. Overall, I wish that Microsoft Excel would improve on it’s compatibility with other software and websites. Though I understand there’s much time, thought, and agreement that needs to be done for this, companies like Amazon and Paypal work with other websites and services to create a smoother use of services. Therefore, Microsoft does have the ability to work better with other companies’ programs, and I wish that both parties would work to do so in the near future.
Both of the above images do not belong to me. ‘Spirited Away’ is the property of Studio Ghibli/Disney and were found here: giphy.com/search/spirited-away-gif