by Tom McGee | Apr 3, 2017 | Tools
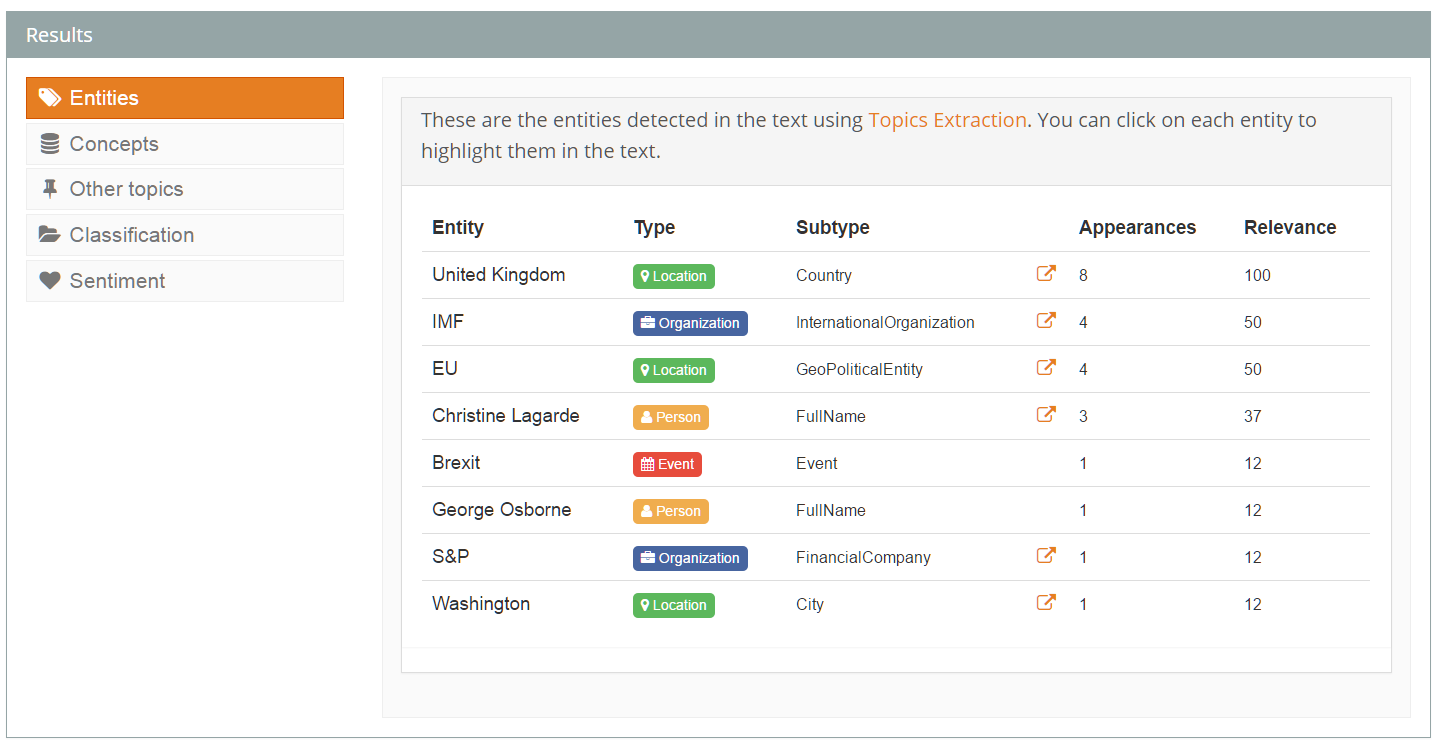
Slides (no notes, sorry) from a presentation about the online text-processing service MeaningCloud. MeaningCloud Slides
by Tom McGee | Dec 2, 2016 | Tools
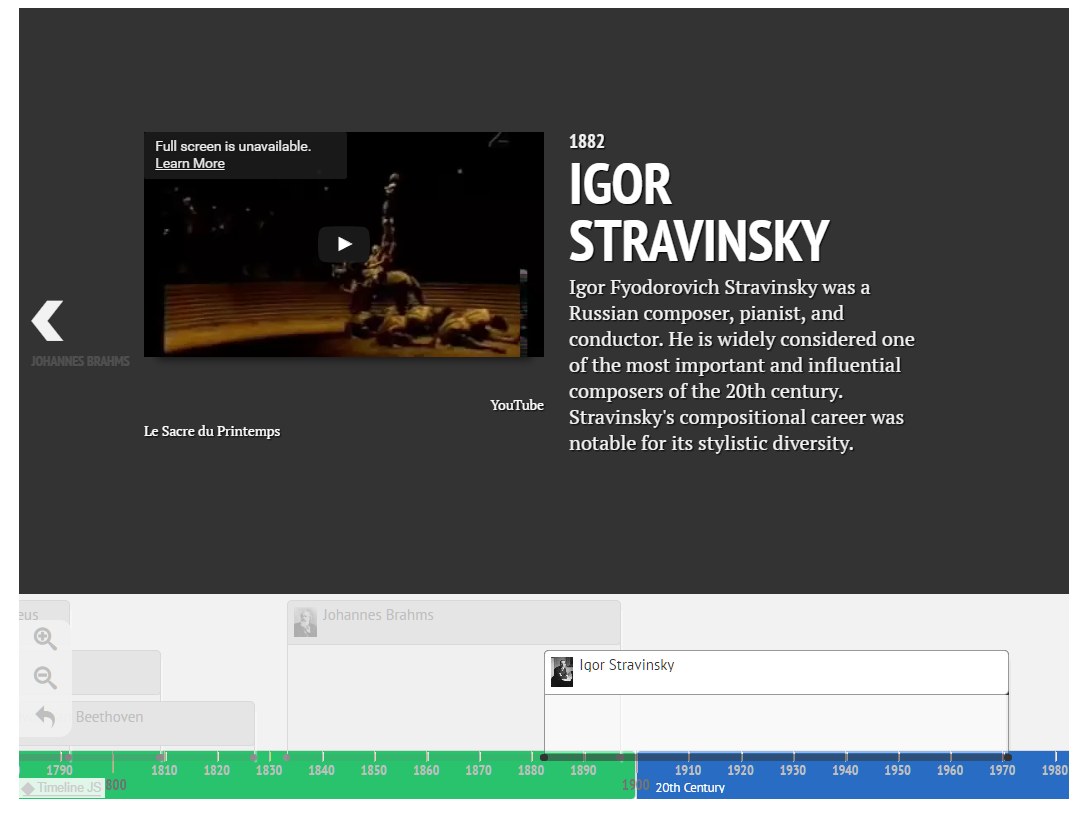
Using Knight Lab’s “Timelines” product, you can easily create sliding horizontal timelines with popups, that include media and graphics. Here’s an example I put together in a few minutes this afternoon, a timeline of classical composers and...
by Tom McGee | Nov 18, 2016 | Tools
by Tom McGee | Nov 9, 2016 | Tools
I found this to be incredibly useful when I needed to get coordinates for a set of hundreds of addresses. The original is from policeanalyst.com, with instructions updated for Excel 2013 from https://grindgis.com/. The process involves adding a new item to your ribbon...
by Tom McGee | May 24, 2016 | Tools
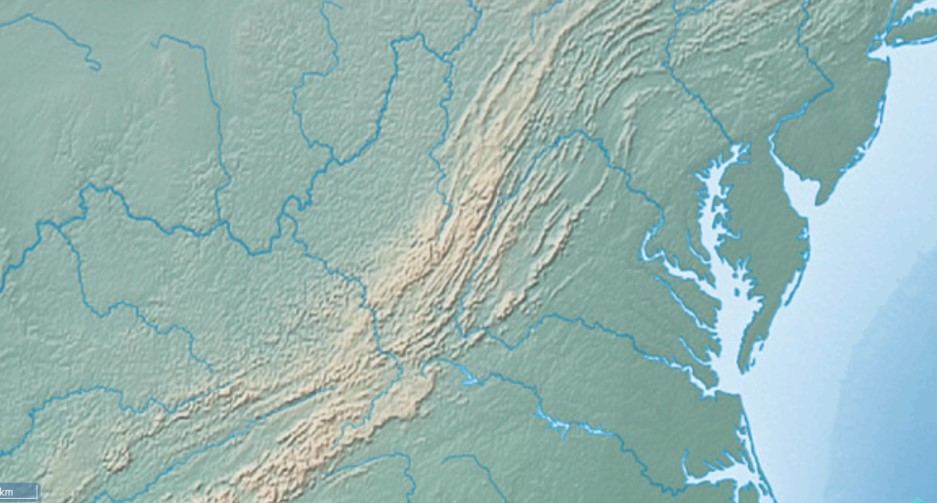
To work with the original version of VisualEyes, start by creating an account, and then building a project. The tutorial for building a basic map and timeline from scratch is available here. Other resources, including full documentation, is on the visualeyes.org web...
by Tom McGee | May 24, 2016 | Presentation, Tools
From Tuesday’s session, here’s the Data, Data and Data Top Level in PowerPoint form. The Data, Data and Data, showing examples of some Excel functions for dealing with XML, how to generate geolocations and more. There are three data sets available to...