Previously in Linguistic Anthropology for Fall 2017, my fellow students and I learned about the US Census and had David Kraiker, a Data Dissemination and GIS Specialist from the Census, talk to the class about what the organization does. As 2020 is fast-approaching, so does the new census to be given out to people residing in the United States. Every decade since it’s inception, the U.S. Census Bureau formulates a new questionnaire for people to answer. The purpose is to collect accurate demographic information and data that can be beneficial for policy making and record keeping. Data collected is publicly available and informs everything from the building of new schools to managing hospitals. As noted in recent news reports and blogs, they have also been used electorally to gerrymander districts. The important and daunting task of data collecting has a wide-reaching impact; what kinds of concerns are raised then when changes are made to the questions asked? A widely reported and controversial change is the addition of a question pertaining to participants’ citizenship status. The addition of the citizenship question for 2020 is now very likely as the Supreme Court is poised to allow the question into the survey.
Blog
Language Death & Dead Languages
In one of our textbooks for Linguistic Anthropology, Language in Society, the author Suzanne Romaine dedicates a part of chapter 2 in exploring the topic of language death. Language death occurs when a language ceases to be spoken and used by people, rendering it non-existent in terms of communication between others.
Language death is a scary concept as it can really happen to any language. What causes this to happen has been debate by linguists, from minority communities being suppressed and overridden by majority force in society, to a phenomenon called “language shift” where a community starts off as bilingual but gradually loses their native tongue.
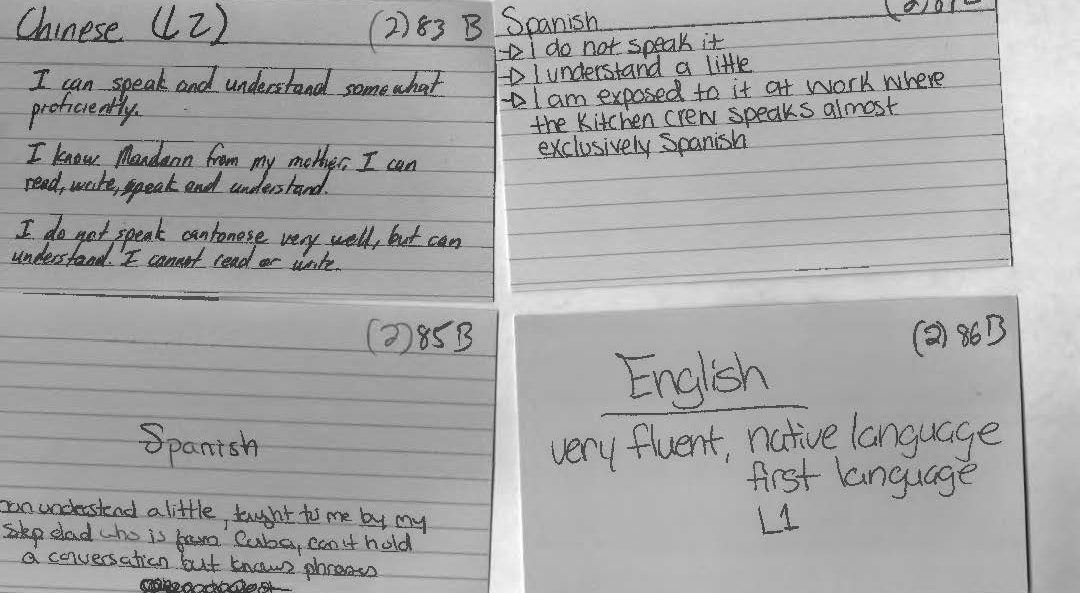
Qualitative Research: Challenges We Encounter
One of the biggest challenges in working with qualitative data such as the very self-directed and open ended responses that our participants provided, is interpreting said statements in a way that generates useful data. I have come to observe that in this particular study, the relatively vague direction prompt that was used when administering the survey (something to the effect of “make a statement about each language that you’re aware of”) yielded responses that were either very informative or very (very) vague. Because we asked participants to hand write their responses on index cards, as opposed to having someone else interview and record their answers, or having them use a digital answer form (like the one found elsewhere on this blog), we also had to contend with some instances of unclear or illegible handwriting. Though deciphering somebody’s handwriting ranks relatively low on the scale of challenges that crop up with qualitative research, it can be nonetheless frustrating. 

Where the Blog is at the Moment

The picture of my desk above illustrates the main issue that we had for the blog during the summer of 2017.
When we all met for our summer meeting, the main problem we had was that we either couldn’t access our Google Drive to get our information or couldn’t connect to the wifi. So to get around not being able to connect to the wifi, Laura suggested that she could get the data from her laptop since Prof. Quizon couldn’t access the drive. However, another problem came up. The laptops we use for this blog is either our personal computers or the laptops the school provides. To log into the laptop the school provides, you need to log into your student email and to do that, you need to have wifi access. But for some odd reason, Laura’s laptop could not recognize the campus wifi.
After finally being able to connect to the wifi and getting all the data we needed, we all discussed issues that came up at that point.
One of the main issues, besides connecting to the internet and getting our data, was how to code some of our data into the excel because all our data was qualitative data. What we decided to do and how we did in detail it is on a different post but it all came down to figuring out how to categorize something into something else.
The second issue, which is something more personal to me than what it is for the others, is how being an alumni affects the productivity of the blog and internship. One of the main issues is just getting onto the blog because we all use our student emails to log in. Not being a student anymore complicates things. The quick fix was to switch to my personal email and then relinquish admin rights after I hand over to the next group.
The final issue touches the first issue but in more detail. It had to do with how to categorize something that doesn’t have a category. For example, how would you categorize learning a language from a hymn or song? Would you say the person can speak and recognize it but not understand it? This issue was brought up by Stephen when he realized that some students who took the survey said they can sing and recognize a language but not actually read or understand it.
The easiest and fastest way we decided to address this problem is just to make a special category for these cases since it only affected about five or six entires. After going through all our issues and trying to figure out a way around them, we all had pizza and left to enjoy the July weather.
Creative Commons
Our research is free for anyone to use. However, we wanted a clear way to express this. Creative Commons is a nonprofit that licenses your research and pictures. When choosing which license, I chose attribution. Put simply, anyone can use our research as long as they give us credit.
Creative Commons does an excellent job of making their site user friendly. The process was simple and easy. I clicked the “Share your work” tab at the top, and filled out the questionnaire. When I was finished they gave me code and told me to post it on our site. At first, I put this on our homepage However, it just looked like code. After a little more trial and error, I put it in the “text” option in the footer of our site. After I did this, the code became a clickable Creative Commons link. Overall, I am very impressed with Creative Commons and highly recommend them for anyone who is trying to license their work.
Building our Site
When deciding what pages to include in our Menu, I had to really think about what pages are on regular websites. I decided that Our Mission Statement should be a our homepage so that when you arrive at our site, you know about our project and our goals. I revised the mission statement several times and finally decided upon the finished product you see now.
My second thought was having a page explaining what exactly we mean by Language Maps and Language Clouds. Dr. Quizon thankfully authored this page with working links.
As a team, we decided to rename the blog page to “The Project”. This was a unanimous decision. We wanted to take people step by step through our process.
Our “Contact Us” page is for anyone who has questions, comments, or wants to use our research which is covered by Creative Commons. The “Contribute” page will be an open forum for anyone who would like to add their languages to our research. We are working now with a WordPress expert who is going to build our questionnaire which will input directly into an Microsoft Excel spread sheet, already coded.
We encourage you to check back soon and contribute your own languages!
The Best and Worst Functions of WordPress
In my opinion, the best function of WordPress is the edit shortcut when you visit your site. This is extremely helpful in the final stages of production because you can view your site, catch a typo or another minor problem, and hit edit. This takes you back to that page or post on that dashboard. It eliminates several steps that you would have to do without this shortcut making editing fast and easy.

The worst function of WordPress is not being able to save a draft of a page. Being a student, I would work on the blog at odd times, sometimes in between classes. Even though a page I was working on was not ready to be viewed by the public, I would have to Publish it just to save my progress. I am a bit of a perfectionist so I found this frustrating to Publish and incomplete version.

Choosing a Blog Theme
Personally, I think my biggest obstacle with creating the blog was choosing a theme. WordPress has many options, so finding a theme wasn’t the problem, finding one that had all the capabilities I wanted was. The first theme I picked which I really liked was called “Vertex”. But there were a few features that I wasn’t thrilled about. First, it took the secondary title “A TLTC Blog” and made it look like button. However, if you clicked on it nothing happened. This was a bit misleading for our viewers. This button was also in the center of our blog page and there was no way to move it, edit it, or delete it.
The second problem with this theme was that it didn’t have an option for a header image. When I first picked this theme, I thought that blank space at the top included the header image but it didn’t.

After some search, I found “Accelerate blog theme to be clean and user friendly. I was also with the rest of the research team when I chose the theme so it was nice to have their thoughts as well.
The Origin of the Project
In the Fall 2015 Linguistic Anthropology class taught by Dr. Quizon, students were asked to share information about any and all languages that they knew. She gave out note cards and instructed the class to write down one language per card. Underneath the name of the language, they were asked to write down anything they wished to say about this language. They used descriptors of their own design making these cards rich with open-ended qualitative data. On the reverse of each card, they were asked to write their names.
With support from Seton Hall’s Digital Humanities Fellowship initiative, Dr. Quizon and three student interns who completed the course in the previous semester took a closer look at this data and explored ways to visualize the information. Were there intriguing or interactive ways to plot linguistic information? Could the data be mapped? Were there patterns to be discovered when expressed in visual form?
The class of 35 students was surveyed twice: once in the beginning of the semester, and again towards the end of the semester. The Language Maps, Language Clouds research team took these two sets of note cards, devised ways to capture, organize and analyze the information using linguistic concepts, explored ways to visualize the results of our queries, and aimed to share our findings online. Our goal is to share both processes and results as we seek to deepen our understanding of the data an interesting, interactive setting.
Even though we all participated in every aspect of the project, we each had an area of expertise. Ellie learned how to use and troubleshoot Viewshare and later, with Dr. Quizon, explored Tableau. She worked with Anastasia who was in charge of Excel and added knowledge of its features as needed for the project. I was in charge of learning how to build a blog on WordPress.