

About 90% of stomach tumors are adenocarcinomas, which are subdivided into two main histologic types: (1) well-differentiated or intestinal type (IGC), and (2) undifferentiated or diffuse type (DGC). The intestinal type is related to corpus-dominant gastritis with gastric atrophy and intestinal metaplasia, whereas the diffuse type usually originates in pangastritis without atrophy. Diffuse gastric cancer (DGC) differs from the more common intestinal (IGC) type in that the former is less differentiated, has a poorer prognosis, and occurs more frequently in younger patients.
The incidence of IGC is decreasing, while the incidence of DGC is increasing. Scirrhous gastric cancer, which has an extremely poor prognosis (5-year survival rate, 10–20%), mainly consist of DGC. Patients with germ line mutations of CDH1 (E-cadherin), which is critical for the epithelial-mesenchymal transition (EMT) and invasion, develop DGC.
What is GDF15 and its expression profile in patients with DGC?
Using secretomics and transcriptomics, researchers recently discovered that the progression of DGC is driven by Growth Differentiation Factor 15 (GDF15), which belongs to the transforming growth factor-beta (TGF- β) family. The protein is expressed in a broad range of cell types, acts as a pleiotropic cytokine and is involved in the stress response program of cells after cellular injury. Increased protein levels are associated with disease states such as tissue hypoxia, inflammation, acute injury and oxidative stress.
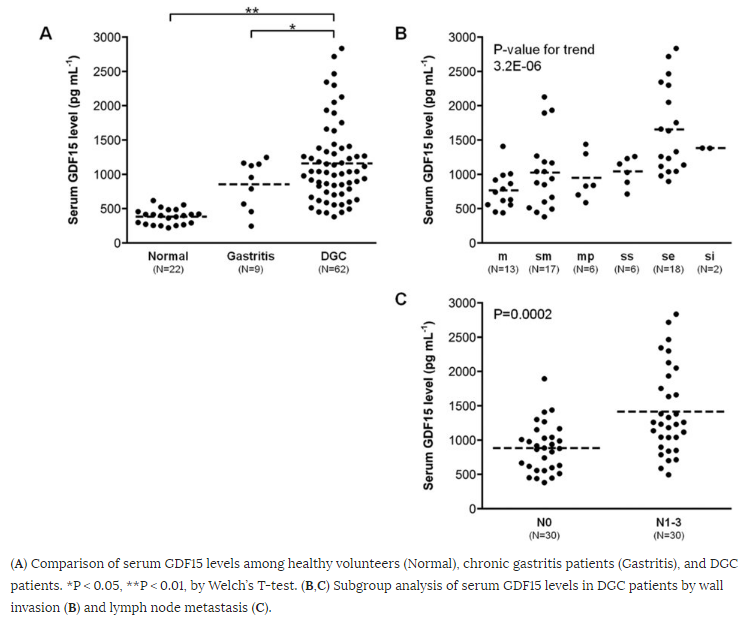
As seen in Figure 1, serum levels of GDF15 were significantly higher in DGC patients (mean ± SD, 1,159 ± 579 pg mL−1) as compared with healthy volunteers (383 ± 110 pg mL−1) and gastritis patients (855 ± 360 pg mL−1). Analyzing subgroups in 62 DGC patients, GDF15 correlated with tumor invasion and was significantly higher in lymph node metastasis positive patients (N0, 885 ± 354 pg mL−1 vs. N1−3, 1,415 ± 635 pg mL−1).
How does GDF15 induce reactive stroma to drive gastric cancer?
TGF-β secreted by cancer cells is important for fibroblast activation [inducing tissue fibroblasts into myofibroblasts or cancer-associated fibroblasts (CAF)], resulting in a reactive stroma [extracellular matrix (ECM)]. A reactive stroma is essential for tumor growth, angiogenesis, invasion, and metastasis, as seen in Figures 2 and 3.
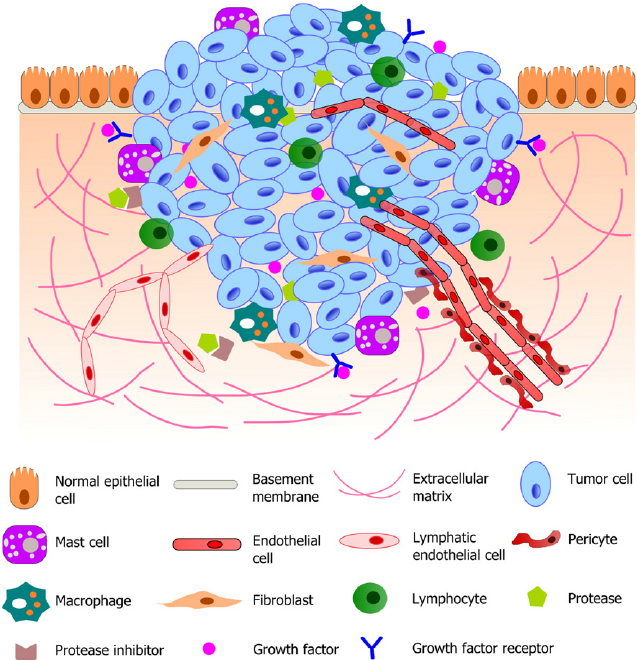
Figure 2. Schematic illustration of a typical tumor microenvironment. Cancer cells reside in a complex microenvironment containing various supporting cells, extracellular matrix (ECM) and a suite of signaling molecules. These environmental components collectively contribute to the tumor-stromal interaction and tumor progression. Adapted from (Joyce and Pollard, 2009; Koontongkaew, 2013). https://www.researchgate.net/figure/264674536_fig1_Fig-1-Schematic-illustration-of-a-typical-tumor-microenvironment-Cancer-cells-reside
Figure 3. The tumor invasion front. Observations on longitudinal sections (top-left corner) of cancers penetrating the host stroma show an octopus-like configuration of cancer spread. After penetrating the basement membrane, epithelial cancers migrate toward the underlying lymphatic or blood vessels, patterned in a branching morphology. In such areas within the stroma, transverse section (yellow line) may reveal patterns of cancer cell “islets”/“cohorts” (top-right corner). In this cartoon, cancer cell cohorts are depicted with black, blood vessels with red roundish shapes and stromal cells (CAFs) are depicted with the background green color. A magnification of the tumor-host cell interface area reveals 2 clearly distinguished subpopulations, the cancer population, and the myofibroblasts. The magnified area is depicted through both a cartoon (left schematic) and a histologic figure (right schematic), obtained from our archive. This interaction area is described as the “tumor invasion front” and it is characterized by “desmoplasia,” or “desmoplastic reaction,” a histopathological lesion defined as the peritumoral accumulation of CAFs with parallel deposition of ECM components. https://mcr.aacrjournals.org/content/10/11/1403.figures-only?cited-by=yes&legid=molcanres;10/11/1403
To what extent does GDF15 mimic the effects of TGF-β?
GFDF15 was shown to induce similar changes in fibroblasts as TGF-β. Proliferation of NIH3T3 fibroblast was significantly promoted by GDF15 as well as TGF-β. Transcriptome analysis (a total of 15,554 genes) identified 45 differentially expressed genes (33 up- and 12 down-regulated) (Figure 4). GDF15 and TGF-β stimulation displayed similar expression patterns in these 45 differentially expressed genes.

Figure 4. (A) Cell proliferation of NIH3T3 fibroblasts by BrdU incorporation assay. CTRL, no stimulation; GDF15, 100 ng mL−1 of GDF15 stimulation; TGF-β, 4 ng mL−1 of TGF-β stimulation. (B) Differential analysis of 15,554 genes in NIH3T3 fibroblasts between CTRL and GDF15 stimulation. In 45 differentially expressed genes, up- and down-regulated genes are highlighted in red (33 genes) or blue circles (12 genes), respectively. (C) Cluster analysis of CTRL, GDF15 or TGF-β stimulation using 45 differentially expressed genes. https://www.nature.com/articles/srep21681/figures/5
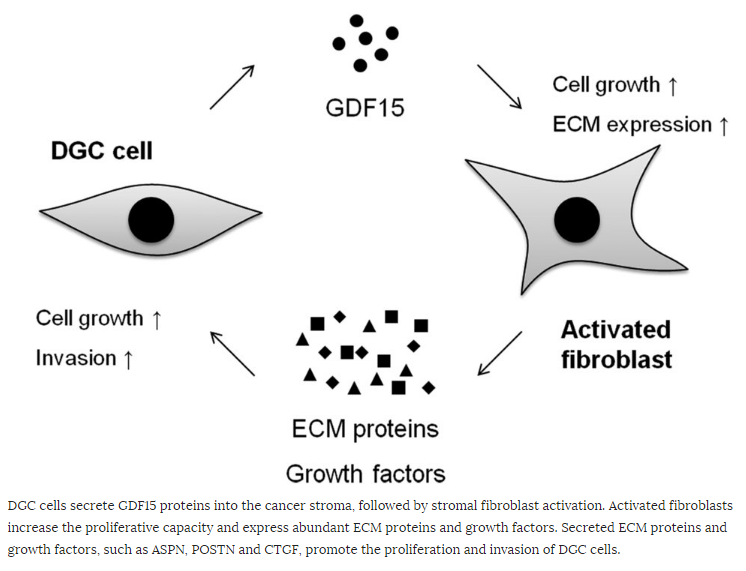
GDF15 enhances gene expression of not only growth factors and ECM components but also Acta2 (α-smooth muscle actin), which is a marker of CAF differentiation, on NIH3T3 fibroblasts. Other genes expressed in CAF and gastric cancer tissues include Aspn, Postn, and Ctgf. In scirrhous gastric cancer, ASPN is predominantly expressed in CAF and promotes cancer cell invasion by activation of the CD44–Rac1 pathway. POSTN was also expressed in CAF in gastric cancer and enhanced the proliferation of gastric cancer cell lines by activation of ERK. In addition, it was reported that CTGF is highly expressed in gastric cancer tissues and associated with undifferentiated-types, lymph node metastasis, and peritoneal dissemination. Thus, GDF15 may also be involved in DGC progression mediated by cancer-stromal interaction through the induction of these genes (Figure 5).
What is the role of GDF15 in other cancers?
Interestingly, GDF15 is also implicated in breast cancer as a means by which breast cancer cells that over-express HER-2 become resistance to anti-HER monoclonal antibody (trastuzumab – Herceptin):
Resistance to the anti-HER2 monoclonal antibody trastuzumab is a major problem in the treatment of HER2-overexpressing metastatic breast cancer. Growth differentiation factor 15 (GDF15), which is structurally similar to TGF beta, has been reported to stimulate phosphorylation of HER2. We tested the hypothesis that GDF15-mediated phosphorylation of HER2 reduces the sensitivity of HER2-overexpressing breast cancer cell lines to trastuzumab. Gene microarray analysis, real-time PCR, and ELISA were used to assess GDF15 expression. Growth inhibition and proliferation assays in response to pharmacologic inhibitors of HER2, TGF beta receptor, or Src were performed on cells stimulated with recombinant human GDF15 or stable GDF15 transfectants. Western blotting was performed to determine effects of GDF15 on HER2 signaling. Cells were infected with lentiviral GDF15 shRNA plasmid to determine effects of GDF15 knockdown on cell survival in response to trastuzumab. Cells with acquired or primary trastuzumab resistance showed increased GDF15 expression. Exposure of trastuzumab-sensitive cells to recombinant human GDF15 or stable transfection of a GDF15 expression plasmid inhibited trastuzumab-mediated growth inhibition. HER2 tyrosine kinase inhibition abrogated GDF15-mediated Akt and Erk1/2 phosphorylation and blocked GDF15-mediated trastuzumab resistance. Pharmacologic inhibition of TGF beta receptor blocked GDF15-mediated phosphorylation of Src. Further, TGF beta receptor inhibition or Src inhibition blocked GDF15-mediated trastuzumab resistance. Finally, lentiviral GDF15 shRNA increased trastuzumab sensitivity in cells with acquired or primary trastuzumab resistance. These results support GDF15-mediated activation of TGF beta receptor-Src-HER2 signaling crosstalk as a novel mechanism of trastuzumab resistance.