
Vietnam
Large-scale South Vietnamese immigration to the United States began after the Vietnam War ended in 1975. Many of the early immigrants were refugee “boat people,” fleeing religious and political persecution or seeking economic opportunities. In 2017, the United States Census Bureau estimated the total population of Vietnamese Americans was 2,104,217. California and Texas had the highest concentrations of Vietnamese Americans: 40 and 12 percent, respectively. Other states with concentrations of Vietnamese Americans were Washington, Florida, and Virginia.
 While only 6.5 percent of Vietnamese are Roman Catholic, 29 to 40 percent of Vietnamese Americans are Roman Catholic, a legacy of the move of Catholics to the South in the mid-1950s when Vietnam was divided into North and South. A smaller number are Protestants.1
Just over 20,500 Vietnamese live in New Jersey. They accounted for just 2.8 percent of the state’s Asian population in 2010. More than one-half of the state’s Vietnamese live in Camden, Atlantic, and Middlesex counties as of 2010. About 21 percent of Vietnamese in New Jersey live in the archdiocese of Newark. Almost half of the Vietnamese population in the archdiocese of Newark live in Hudson County. The largest Vietnamese populations in the archdiocese of Newark are in Jersey City (1,607) and Belleville (341).2
Several Vietnamese immigrants have been ordained priests of the archdiocese of Newark and minister in a variety of settings.

Although their numbers are small in the Archdiocese of Newark, Vietnamese Catholics are fervent in their faith. Mass is celebrated in Vietnamese at Saint Michael’s in Jersey City and in Christ the King in Hillside.
Vietnamese in the Archdiocese of Newark
| NJ | Bergen | Essex | Hudson | Union | RCAN | |
|---|---|---|---|---|---|---|
| 2010 | 20,628 | 734 | 967 | 1,973 | 662 | 4,336 |
| 2017* | 26,400 | 1,283 | 1,397 | 2,508 | 996 | 6,184 |
Decennial figures are United States Census figures for that year
*Figures are United States Census Factfinder Estimates
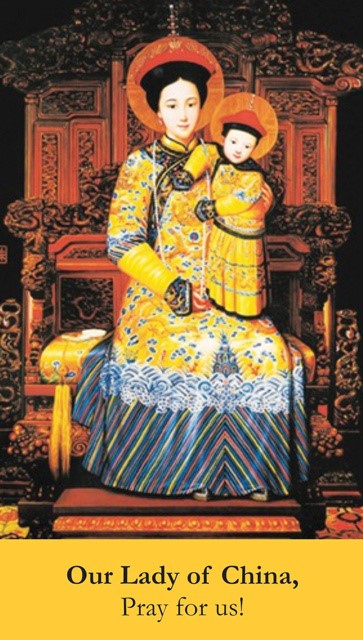
China
Chinese immigrants were the object of extreme prejudice in 19th and 20th century America. The notorious “Chinese Exclusion Act” of 1882 illustrates this in its name alone. The restrictive immigration law as of the 1920s reinforced this bias.
Only since the 1940s when the United States and China became allies during World War II, did the situation for Chinese Americans begin to improve, as restrictions on entry into the country, naturalization, and mixed marriages decreased. In 1943, the Magnussen Act permitted Chinese immigration, repealing 61 years of official racial discrimination against the Chinese.
Large-scale Chinese immigration did not occur until 1965 when the Immigration and Nationality Act of 1965 lifted national origin quotas. After World War II, anti-Asian prejudice began to decrease. Currently, Chinese constitute the largest ethnic group of Asian Americans (about 22 percent). According to the 2010 United States census, there are more than 3.3 million Chinese in the United States, about one percent of the total population.
United States policy of maintaining separate quotas for the People’s Republic of China, Taiwan (Republic of China), and Hong Kong facilitates ethnic Chinese immigration.
In addition to documented immigrants, there is a large number of undocumented aliens, who came to the United States in search of lower level manual jobs. Quantification of their numbers is very difficult.
彌撒圣祭
Chinese in the Archdiocese of Newark
| NJ | Bergen | Essex | Hudson | Union | RCAN | |
|---|---|---|---|---|---|---|
| 2010 Chinese | 134,442 | 17,236 | 9,020 | 11,239 | 5,410 | 42,905 |
| 2017*Chinese excluding Taiwanese | 168,323 | 23,190 | 11,228 | 18,253 | 7,933 | 60,604 |
| 2017* Taiwanese | 8,027 | 1,279 | 486 | 560 | 122 | 2,447 |
Decennial figures are United States Census figures for that year
*Figures are United States Census Factfinder Estimates
About one-third of Chinese Americans in New Jersey live within the Archdiocese of Newark. Pew studies reveal that over half (52 percent) of Chinese Americans have no religious affiliation. Fifteen percent are Buddhist, eight percent are Catholic, and 22 percent belong to a Protestant denomination.
Chinese Population by city3
| Jersey City | 5,643 |
| Livingston | 2,891 |
| Fort Lee | 2,653 |
| Harrison | 1,096 |
| Paramus | 977 |
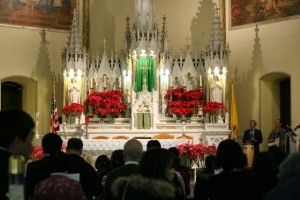
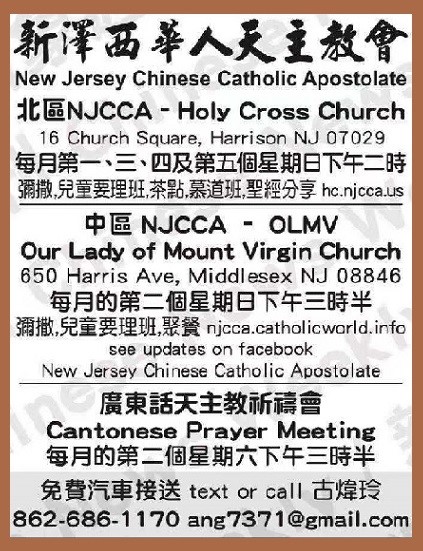
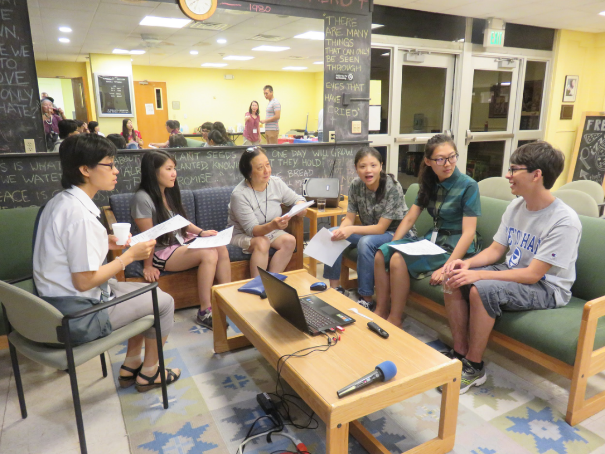
Unfortunately, at present there is no Chinese-speaking priest engaged in full-time ministry in the archdiocese. However, Mass is celebrated in Chinese weekly in Holy Cross Church in Harrison. While small in numbers, the Chinese Catholic community is very active in evangelization. They regularly meet with Chinese students at Seton Hall University to assist them in adjusting to life in the United States and to acquaint them with the Catholic faith.
India
According to the 2010 United States Census, the Asian Indian population in the United States grew from almost 1,678,765 in 2000 to 2,843,391, one of the fastest growing ethnic groups in the United States.
Prior to 1965, Indian immigration to the U.S. was small and isolated, with fewer than 50,000 Indian immigrants in the country. Although labeled “Hindu” in early census reports, the majority of Indians were Sikh. In the 1923 case, United States v. Bhagat Singh Thind, the Supreme Court ruled that Punjabis were not “white persons” and were therefore racially ineligible for naturalized citizenship. The Immigration and Nationality Act of 1965 dramatically opened entry to the United States to immigrants other than traditional Northern European groups.
Population of Asian Indian heritage in the United States
| 1910 | 1920 | 1930 | 1940 | 1980 | 1990 | 2000 | 2010 | 2017 |
| 2,545 | 2,507 | 3,130 | 2,405 | 361,531 | 815,447 | 1,678,765 | 2,843,391 | 4,402,362 |

According to 2012 Pew Research Center research, 51 percent of Indian Americans consider themselves Hindu, 18 percent Christian (Protestant eleven percent, Catholic five percent, other Christian three percent), 27 percent as other or unaffiliated.
Catholic Christians are divided into several groups: Syro-Malabar Catholics, Syro-Malankara Catholics, both mostly from Kerala, and Latin Rite Catholics from both Goa and Kerala.4 Only New York and California have more citizens of Indian heritage than New Jersey. Almost one third of the Asian Indians in New Jersey reside within the archdiocese of Newark.
Asian Indian Population
| NJ | Bergen | Essex | Hudson | Union | RCAN | |
|---|---|---|---|---|---|---|
| 2010 | 292,256 | 24,973 | 10,853 | 37,236 | 7,607 | 80,669 |
| 2017* | 384,072 | 39,187 | 15,434 | 48,450 | 9,172 | 112,243 |
Decennial figures are United States Census figures for that year
*Figures are United States Census Factfinder Estimates
Cities with Largest Asian Indian Populations
| Jersey City | 27,111 |
| North Bergen | 2,271 |
| Hackensack | 1,850 |
| Newark | 1,848 |
| West Orange | 1,377 |
The Liturgy is celebrated in the Syro-Malabar Rite in Our Lady of Sorrows in Garfield and in Saint John the Baptist in Jersey City. The Liturgy is celebrated in the Syro-Malankara Rite in Saint John the Baptist in Jersey City.
Mass is celebrated in Keralan in Saint Anastasia in Teaneck.5
«VII. Filipino Immigration« : »IX. Haiti and Africa»
Footnotes
- https://en.wikipedia.org/wiki/Vietnamese_Americans
- Office of Research and Planning, Archdiocese of Newark, https://www.rcan.org/offices-and-ministries/research-planning/asian
- Office of Research and Planning, Archdiocese of Newark, https://www.rcan.org/offices-and-ministries/research-planning/asian
- https://en.wikipedia.org/wiki/Indian_Americans
- Office of Research and Planning, Archdiocese of Newark, https://www.rcan.org/offices-and-ministries/research-planning/asian