
The Rich Variety of Hispanic Catholic Heritage
Santo Domingo and Mexico
The first two Hispanic groups to arrive in great numbers in the archdiocese of Newark, the Puerto Ricans and the Cubans, grew very quickly. Soon, other Hispanics took advantage of the 1965 immigration laws and came to the United States and the Archdiocese of Newark in astounding numbers. In most instances, they would follow the pattern of ecclesial life established by the Puerto Ricans and the Cubans, and integrate into existing parishes and, eventually, into Archdiocesan structures.
The poverty, political oppression, and criminal violence prevalent in many Latin American countries in great part had contributed to the great migration of Hispanics to the United States. Desperation often leads people to take measures that otherwise they would not consider.
According to the Migration Policy Institute1 in 2018, there were almost a quarter million undocumented persons, mostly Hispanics, in New Jersey.
| Mexican | 102,000 |
| Guatemalan | 42,000 |
| Ecuadorean | 38,000 |
| Indian | 36,000 |
| Dominicans (D.R.) | 25,000 |
The pastoral care of these migrants poses a great challenge to the Church in New Jersey.
We shall first look at two large groups – Dominicans and Mexicans.
Dominican Republic – Santo Domingo
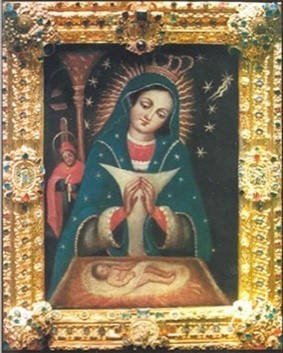
After the Puerto Ricans, the largest Hispanic group in the archdiocese of Newark is the Dominicans. These are people whose heritage is from Dominican Republic, sometimes called the “D.R.”. This nation occupies the eastern two-thirds of the Caribbean island of Hispaniola. The diocese of its capital, Santo Domingo, created on August 8, 1511, is the first diocese established in the Western Hemisphere.
Although about 5,000 Dominicans immigrated before 1924,2 there was no significant immigration to the United States until the latter part of the 20th century. The Dominican Republic has had a complex relationship with the United States. The United States twice invaded and occupied the Dominican Republic, first from 1916 to 1924, and again in 1965.
The second United States invasion played a more significant role in launching the most recent migration of Dominicans to the United States. The assassination of military ruler Rafael Trujillo in 1961 marked the start of a period of political uncertainty in the Dominican Republic that ended in 1965 when United States armed forces intervened by order of President Lyndon Johnson.
The civil unrest and the intervention by the United States on the side of the conservative military led many supporters of the losing side to emigrate in the 1960s. Those emigrants, most of whom came to the United States, were the first of many Dominicans who have come in ever-increasing numbers in the past several decades.3
In the 1980s, immigration to the United States from the Dominican Republic rose to unprecedented levels. The U.S. Census Bureau provided a separate category for Dominicans in the 1990 census. “The number of Dominicans legally entering the United States between 1981 and 1990 was far greater than the number of Cubans: indeed, more Dominicans entered the United States in the (1980s) than any other Western Hemisphere national group except migrants from Mexico.”4 The majority of Dominicans in the later immigration were laborers in low-paying jobs.
Despite their numbers, however, Dominican immigrants have been relatively unstudied. Religion remains little commented upon in the literature on Dominicans in the United States. Dominicans in the Caribbean are approximately 57 percent Catholic.
According to the 2010 census, The Dominican population of New Jersey almost doubled in ten years. Of the 197,922 Dominicans in New Jersey, almost half (97,039) live in the archdiocese of Newark. The largest number are in Hudson County, followed by Bergen County. The United States Census Bureau’s estimates for 2017 show a very significant growth in the Dominican population in New Jersey and especially in the Archdiocese of Newark.
Dominican Population in the Archdiocese of Newark
| Bergen | Essex | Hudson | Union | RCAN | |
|---|---|---|---|---|---|
| 2010 | 24,527 | 19,055 | 41,174 | 12,283 | 97,039 |
| 2017* | 34,910 | 27,195 | 53,021 | 18,709 | 133,835 |
Dominican Population in New Jersey
| 1990 NJ | 2000 NJ | 2010 NJ | 2010 RCAN |
2017* NJ | 2017* RCAN |
|
|---|---|---|---|---|---|---|
| Dominican | 52,807 | 102,630 | 197,922 | 97,039 | 266,790 | 133,835 |
Decennial dates are Official United States Census
*United States Census Bureau Estimate
The cities in the archdiocese with the largest number of Dominicans are Jersey City (13,512), Newark (12,527), Union City (10,020), Elizabeth (7,073), and West New York (4,935).
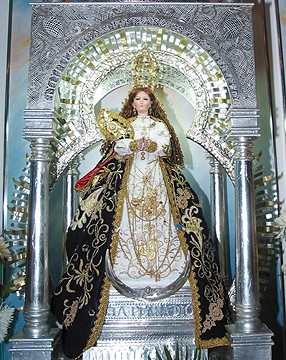
Mexico

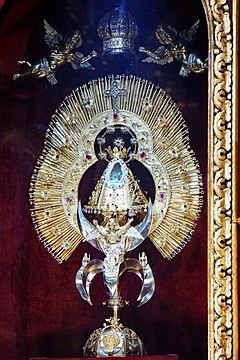
Emperatriz de America
Like much of the nation, New Jersey has seen its Hispanic population grow at an amazing rate over the last 10 years. This is nothing new in a state with long-established and large Puerto Rican, Cuban, Dominican, and Central American communities, and many other smaller groups.
The presence of very large Mexican communities in the southwest and especially in California has been part of the story of 20th and early 21st century immigration for decades. In recent years, Mexican immigrants spread to many parts of the United States, including the northeast. Many Mexicans first came to New Jersey as seasonal farm workers in the southern part of the state. They then stayed on and more joined them. Most have low-income employment, working in the restaurant and housekeeping areas.
In the late 20th century, the Mexican population suddenly exploded in New Jersey. From just over 6,000 in 1970, they soared to 121,000 in 2000,5 and then almost doubled in the next ten years, to 217,715 in 2010.6
About one quarter, 56,673 of 239,179, of New Jersey’s Mexican population live in the archdiocese of Newark.7 While Mexicans live throughout the four counties, the cities with the largest Mexican populations are Newark, Elizabeth, West New York, Union City, and Jersey City. About 81 percent of the population of Mexico is Catholic. The presence of large Hispanic communities in these cities made the integration of the Mexican immigrants easier. There are more than 10,000 Mexicans in Bergen, Essex, and Union counties, and more than 20,000 in Hudson County.
Mexican Population in New Jersey
| 1970 NJ | 1980 NJ | 1990 NJ | 2000 NJ | 2010 NJ | 2010 RCAN | 2017* NJ | 2017* RCAN |
|---|---|---|---|---|---|---|---|
| 6,343 | 13,146 | 28,365 | 102,929 | 217,715 | 47,858 | 239,179 | 56,673 |
Mexican Population in the Archdiocese of Newark
| Bergen | Essex | Hudson | Union | RCAN | |
|---|---|---|---|---|---|
| 2010 | 8,974 | 9,002 | 19,999 | 9,883 | 47,858 |
| 2017* | 12,276 | 10,098 | 22,161 | 12,138 | 56,673 |
Decennial dates are Official United States Census
*United States Census Bureau Estimate
Colombia, Ecuador, and Peru
Colombia

In the early 20th century, a small number of Colombians immigrated to United States, mostly settling in New York. Due to internal strife in Colombia, more immigrated during the 1950s. The economic crises of the 1960s brought more Colombians to the United States.
The majority immigrated in the 1980s and 1990s as conflicts escalated among guerrillas, paramilitaries, and narcotics traffickers. Only Florida and New York have more Colombian immigrants than New Jersey.
Colombians generally are more educated and more professionally trained than are other Hispanic immigrants. Some are professionals who are unable to have their qualifications ratified by American agencies. The majority of the more affluent live in the suburbs. However, this is not true for all Colombians. Many are not well educated and work in low wage jobs in the service industry.
Almost 80 percent of Colombians are Catholic, one of the highest percentages in Latin America. The 67,653 Colombians in the archdiocese of Newark are almost 60 percent of all the Colombians in New Jersey. Almost equal numbers of Colombians live in Bergen, Hudson, and Union counties, while there is a much smaller number in Essex County.
Colombians in the Archdiocese of Newark
| Bergen | Essex | Hudson | Union | RCAN | NJ | ||
|---|---|---|---|---|---|---|---|
| 2010 | 18,486 | 4,116 | 16,743 | 17,750 | 57,095 | 101,593 | |
| 2017* | 20,777 | 5,068 | 20,299 | 21,509 | 67,653 | 121,902 |
Colombians in New Jersey
| 1990 NJ | 2000 NJ | 2010 NJ | 2010 RCAN | 2017* NJ | 2017* RCAN | |
|---|---|---|---|---|---|---|
| 52,210 | 65,075 | 101,593 | 57,097 | 121,902 | 67,653 |
Decennial dates are Official United States Census
*United States Census Bureau Estimate
Ecuador
Until the 1960s, only about 11,000 Ecuadorians had migrated to the United States. Most Ecuadorian immigration to the United States has occurred since the early 1970s. The Ecuadorian land reform of 1964 forced many small landowners to sell their property. Many then migrated to the United States.
Continued economic difficulties in the 1980s and 1990s, and political turmoil in the late 1990s, drove further emigration. In 1986, the Immigration Reform and Control Act legalized the status of 16,292 Ecuadorians in the United States and spurred a large increase in family-sponsored Ecuadorian migration to America.8
Ecuadorian Americans come from every part of Ecuador. During the 1970s, most of the Ecuadorians came from the northern and central highlands, including the area around Quito. In the 1980s, many Ecuadorians came from the coast. In the 1990s, most came from the southern highlands. They are in every economic level but a large number are quite poor.
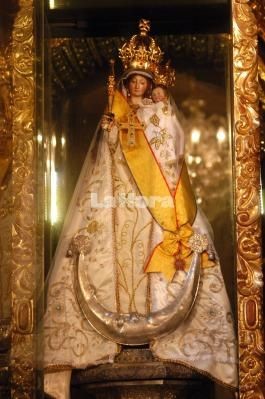
In Ecuador, 79 percent of the population is Catholic. The number of Ecuadorians in New Jersey almost quadrupled between 1990 and 2010, and continues to grow. Almost three-quarters (91,121 of 125,475) of Ecuadorians in New Jersey live within the archdiocese of Newark. The largest concentrations of Ecuadorians are in Hudson and Essex counties. Among the cities with large Ecuadorian populations are Belleville, Union City, Harrison, Jersey City, Newark, and Elizabeth. Ecuadorians in New Jersey are the second largest concentration in the United States, following New York.
Ecuadorians have a deep devotion to the Blessed Virgin. In particular, this devotion focuses on Our Lady of Quinche. The Ecuadorian community has established a shrine to Our Lady of Quinche in Saint Patrick’s Pro-Cathedral in Newark.
Ecuadorians in the Archdiocese of Newark
| Bergen | Essex | Hudson | Union | RCAN | NJ | ||
|---|---|---|---|---|---|---|---|
| 2010 | 12,657 | 25,169 | 26,650 | 10,967 | 75,443 | 100,480 | |
| 2017* | 16,653 | 30,056 | 31,736 | 12,676 | 91,121 | 125,475 |
Ecuadorians in New Jersey
| 1990 NJ | 2000 NJ | 2010 NJ | 2010 RCAN | 2017* NJ | 2017* RCAN | |
|---|---|---|---|---|---|---|
| 27,572 | 45,392 | 100,480 | 75,443 | 125,475 | 91,121 |
Decennial dates are Official United States Census
*United States Census Bureau Estimate
Peru

Peruvian Americans are relatively recent arrivals, as most of them migrated to the United States after 1990, following political and economic turmoil. New Jersey has the third largest number of Peruvian immigrants, following Florida and California.9 The number tripled between 1990 and 2010. Cities with large numbers of Peruvians are East Newark, Harrison, Kearny, Garfield, Elizabeth, and Union City.
Now well into a second generation of American-born Peruvians, many enjoy a measure of economic success. Despite being relatively recent immigrants, the median household income for Peruvians is near the average American household income and 30 percent of all Peruvians over the age of 25 have college degrees, exceeding the United States national average of 24 percent.10
Peruvians in the Archdiocese of Newark
| Bergen | Essex | Hudson | Union | RCAN | ||
|---|---|---|---|---|---|---|
| 2010 | 7,360 | 7,402 | 13,533 | 9,446 | 37,741 | |
| 2017* | 9,655 | 8,615 | 15,255 | 10,812 | 44,337 |
Peruvians in New Jersey
| 1990 NJ | 2000 NJ | 2010 NJ | 2010 RCAN | 2017 NJ | 2017 RCAN | |
|---|---|---|---|---|---|---|
| 24,433 | 37,672 | 75,869 | 37,741 | 87,820 | 44,337 |
Decennial dates are Official United States Census
*United States Census Bureau Estimate
Half of the Peruvians in New Jersey reside in the archdiocese of Newark. The greatest number of Peruvians in the archdiocese reside in Hudson County. In Peru, the percentage of Catholics was 76, one of the highest in Latin America.
While like all Latin American Catholics, Peruvians have a deep devotion to the Mother of God, they also have a special devotion to Our Lord of the Miracles. In Hudson County, the Hermandad del Señor de los Milagros, or Brotherhood of the Lord of Miracles, stages an annual procession with the help of three participating churches: Saint Cecilia’s in Kearny, Saint Anthony’s in East Newark, and Holy Cross Church in Harrison. A large depiction of Christ’s crucifixion is borne aloft along a 20-block route within the three towns. “To carry it, you need 32 men,” a devotee said. As the men pass, clad in purple tunics, Peruvian women sing prayers.11
Central America
Guatemala, El Salvador, Nicaragua, Honduras, Costa Rica, Panama
Immigrants to the United States Born in Central America
| 1960 | 1970 | 1980 | 1990 | 2000 | 2010 | 2017* |
|---|---|---|---|---|---|---|
| 48,900 | 113,900 | 353,900 | 1,134,000 | 2,026,200 | 3,052,500 | 3,255,182 |
Decennial dates are Official United States Census
*United States Census Bureau Estimate
The rapid growth in the population of migrants to the United States born in Central America between 1960 and 2017 is due in large part by increased immigration from El Salvador, Guatemala, and (more recently) Honduras. The population of immigrants born in El Salvador has grown by more than 200 times its size in 1960; the population of Guatemalan immigrants has grown by more than 150 times its size in 1960; and the population of Hondurans has grown by more than 75 times its size in 1960. Increased immigration from these three countries alone accounts for 85 percent of the growth in the Central American-born population over this period.12 While these countries sent a large number of migrants, the number from Nicaragua, Costa Rica, and Panama is comparatively small.
This chart shows the growth of the Central American immigration since the 1980s. In particular, the increase in the numbers of the Salvadoran, Guatemalan, and Honduran immigrants demonstrates the effects of the civil turmoil and the rampant crime in these nations. More than two-thirds of the Salvadoran immigrants, about one-half of the Honduran immigrants, and just under half of the Guatemalan immigrants in New Jersey live within the archdiocese of Newark. Fifty-five percent of all Central American immigrants live in the archdiocese of Newark.
The Growth of Central Americans in New Jersey and the Archdiocese of Newark
| 1970 NJ | 1980 NJ | 1990 NJ | 2000 NJ | |
|---|---|---|---|---|
| Total pop NJ | 7,171,112 | 7,365,011 | 7,730,188 | 8,414,350 |
| Hispanic NJ | 288,488 | 491,883 | 739,861 | 1,117,191 |
| Non-Hispanic NJ | 6,882,624 | 6,679,229 | 6,990,327 | 7,297,159 |
| Central Amer. (non-Mexican) |
44,715 | 80,497 | ||
| Costa Rican | 4,925 | 11,175 | ||
| Guatemalan | 7,473 | 16,992 | ||
| Honduran | 8,045 | 15,431 | ||
| Nicaraguan | 4,326 | 4,384 | ||
| Panamanian | 2,937 | 3,021 | ||
| Salvadoran | 16,817 | 25,230 | ||
| Other C.A. | 292 | 4,264 |
| 2010 NJ | 2010 RCAN | 2017* NJ | 2017* RCAN | ||
|---|---|---|---|---|---|
| Total pop NJ | 8,791,894 | 2,859,650 | 8,960,161 | 2,975,397 | |
| Hispanic NJ | 1,555,144 | 718,955 | 1,764,520 | 821,248 | |
| Non-Hispanic NJ | 7,236,750 | 2,140,895 | 7,195,641 | 2,154,149 | |
| Central Amer. (non-Mexican) |
176,611 | 97,280 | 217,936 | 117,620 | |
| Costa Rican | 19,933 | 7,001 | 20,900 | 7,401 | |
| Guatemalan | 48,869 | 22,619 | 61,806 | 29,075 | |
| Honduran | 36,566 | 17,971 | 48,084 | 24,124 | |
| Nicaraguan | 8,222 | 3,495 | 9,026 | 3,937 | |
| Panamanian | 5,431 | 2,286 | 6,876 | 2,985 | |
| Salvadoran | 56,532 | 40,394 | 70,833 | 50,033 | |
| Other C.A. | 1,086 | 566 | 411 | 101 |
Decennial dates are Official United States Census
*United States Census Bureau Estimate
The largest number of Salvadoran, Guatemalan, Honduran, and other Central American immigrants live in Hudson and Union Counties. Of the almost 100,000 Central American immigrants in the archdiocese, based upon religious identification in their home countries, about half are Roman Catholic.
Central Americans by County
| % RC | Bergen
|
Essex
|
Hudson
|
Union
|
RCAN | ||
|---|---|---|---|---|---|---|---|
| Total | 2010 | 905,116 | 783,969 | 634,266 | 536,499 | 2,859,650 | |
| 2017* | 937,920 | 800,401 | 679,756 | 557,320 | |||
| Hispanic | 2010 | 55 | 145,281 | 159,117 | 267,853 | 146,704 | 718,955 |
| 2017* | c. 55 | 176,933 | 179,661 | 293,465 | 171,189 | ||
| Central Am. (no Mexican) |
2010 | 16,021 | 14,746 | 34,780 | 28,733 | 97,280 | |
| 2017* | 18,894 | 20,525 | 43,786 | 34,415 | |||
| Costa Rican | 2010 | 62 | 1,345 | 1,638 | 818 | 3,200 | 7,001 |
| 2017* | 1,667 | 1,867 | 963 | 2,904 | 7,401 | ||
| Guatemalan | 2010 | 50 | 6,165 | 3,293 | 6,878 | 6,283 | 22,619 |
| 2017* | 6,064 | 4,552 | 10,013 | 8,446 | 29,075 | ||
| Honduran | 2010 | 46 | 1,346 | 3,143 | 8,862 | 4,620 | 17,971 |
| 2017* | 2,425 | 5,133 | 11,800 | 4,766 | 24,124 | ||
| Nicaraguan | 2010 | 50 | 540 | 560 | 1,564 | 831 | 3,495 |
| 2017* | 451 | 1,091 | 1,237 | 1,158 | 3,937 | ||
| Panamanian | 2010 | 70 | 438 | 626 | 698 | 474 | 2,286 |
| 2017* | 714 | 645 | 1,016 | 609 | 2,984 | ||
| Salvadoran | 2010 | 50 | 6,073 | 5,375 | 15,767 | 13,179 | 40,394 |
| 2017* | 7,573 | 7,213 | 18,685 | 16,562 | 50,033 | ||
| Other C.A. | 2010 | 114 | 111 | 195 | 146 | 566 | |
| 2017* | 0 | 23 | 72 | 6 | 101 |
Decennial dates are Official United States Census
*United States Census Bureau Estimate
El Salvador, Guatemala, Honduras
El Salvador
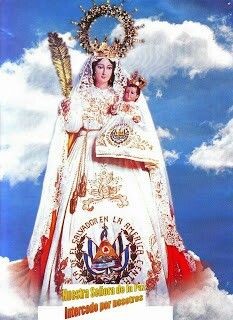
As of 2010, there are 2,195,477 Salvadoran Americans in the United States, the fourth-largest Hispanic community by nation of ancestry. The first Salvadorans that came to the United States before the El Salvador Civil War (1979-1992) were mostly working-class. In the 1960s and early 1970s, most of the immigrants were women; they found work as housekeepers or in childcare. There are significant numbers of Salvadorans living in Elizabeth and West New York.
Documented Salvadorans13 Entering the United States
| 1931-40 | 1941-50 | 1951-60 | 1961-70 | 1971-80 | 1981-90 | 1991-00 |
|---|---|---|---|---|---|---|
| 631 | 5,132 | 5,859 | 14,992 | 34,436 | 213,529 | 215,789 |
While Salvadoran migration to the U.S. remained low throughout the first several decades in the 20th century, it spiked at the onset of the Salvadoran Civil War, when many fled to the United States seeking sanctuary from the devastation that plagued the country, and United States immigration laws were liberalized. However, many Salvadorans came to the United States undocumented and applied for asylum and/or work permits in order to legalize their status. This massive migration to the U.S. was a result of political violence as much as it was the deteriorating economic conditions in El Salvador. By the end of 1989, more than 250,000 Salvadorans had migrated to the U.S. The unofficial number was about one million.
The flood of refugees from a United States supported government forced a national rethinking of foreign policy priorities. Salvadoran Americans are at the center of an ongoing national debate about United States responsibility toward the world’s refugees and the future of immigration in general.
The number of Salvadorans in the United States, documented and undocumented, is amazing when one considers the small size of the country. Salvadorans are the United States’ fifth largest immigrant group after Mexican, Filipino, Indian, and Chinese. In the archdiocese of Newark, the majority of Salvadorans live in Hudson and Union counties.
Salvadorans in New Jersey
| 1990 NJ | 2000 NJ | 2010 NJ | 2010 RCAN | 2017* NJ | 2017* RCAN | |
|---|---|---|---|---|---|---|
| 16,817 | 25,230 | 56,532 | 40,394 | 70,833 | 50,033 |
Salvadorans in the Archdiocese of Newark
| Bergen | Essex | Hudson | Union | RCAN | ||
|---|---|---|---|---|---|---|
| 2010 | 6,073 | 5,375 | 15,767 | 13,179 | 40,394 | |
| 2017* | 7,573 | 7,213 | 18,685 | 16,562 | 50,033 |
Guatemala

Guatemalans have migrated to the USA since the 1930s and 1940s. The large influx of Guatemalans into United States began in the 1970s and 1980s, and peaked in the 1990s due to the Guatemalan civil war. During this period tens of thousands of Guatemalan refugees, both documented and undocumented, came to the United States through Mexico. Some estimates say that almost three-quarters of Guatemalan immigrants are undocumented.14
Guatemalan Americans are a very culturally diverse group of people. Although the majority are Maya, they include about 23 distinct ethnic groups, whose languages and cultural traditions are quite different.15
The Guatemalan American population at the 2010 Census was 1,044,209. Guatemalans are the sixth largest Latino group in the United States and the second largest Central American population after Salvadorans. Half of the Guatemalan population is in the Northeast and in Southern California. In the archdiocese of Newark, there are large numbers of Guatemalans in Plainfield and Fairview. Almost half of the Guatemalans in New Jersey live in the archdiocese of Newark. It is estimated that 50 percent of Guatemalans are Catholic.
Guatemalans in New Jersey
| 1990 NJ | 2000 NJ | 2010 NJ | 2010 RCAN | 2017* NJ | 2017* RCAN | |
|---|---|---|---|---|---|---|
| 7,473 | 16,992 | 48,869 | 22,619 | 61,806 | 29,075 |
Guatemalans in the Archdiocese of Newark
| Bergen | Essex | Hudson | Union | RCAN | ||
|---|---|---|---|---|---|---|
| 2010 | 6,165 | 3,293 | 6,878 | 6,283 | 22,619 | |
| 2017* | 6,064 | 4,552 | 10,013 | 8,446 | 29,619 |
Decennial dates are Official United States Census
*United States Census Bureau Estimate
Honduras

While a small number of Hondurans came to the United States in the 19th century, large numbers came in the late 20th century, following the changes in United States immigration law. Like most immigrants, Hondurans left their country to escape poverty and seek a better life in the United States. The number of Honduran immigrants has increased in recent years due to increasing lawlessness in the country. Many Honduran Americans are migrant farm laborers who first established themselves in the large cities.
In 2000, Hondurans grew to be the third largest immigrant group from Central America.16 Hondurans are concentrated in the South and in the Northeast.17
Hondurans in New Jersey
| 1990 NJ | 2000 NJ | 2010 NJ | 2010 RCAN | 2017* NJ | 2017* RCAN | |
|---|---|---|---|---|---|---|
| 8,045 | 15,431 | 36,556 | 17,971 | 48,084 | 24,124 |
About half of Hondurans in New Jersey live in the archdiocese of Newark. Most are in northern Hudson County and Union County. Pew estimates that only 46 percent of Hondurans are affiliated with the Catholic Church.
Hondurans in the Archdiocese of Newark
| Bergen | Essex | Hudson | Union | RCAN | ||
|---|---|---|---|---|---|---|
| 2010 | 1,346 | 3,143 | 8,862 | 4,620 | 17,971 | |
| 2017* | 2,425 | 5,133 | 11,800 | 4,766 | 24,124 |
Decennial dates are Official United States Census
*United States Census Bureau Estimate
Nicaragua, Costa Rica, and Panama
Nicaragua
According to the United States Census Bureau, about 7,500 Nicaraguans immigrated from 1967 to 1976. An estimated 28,620 Nicaraguans were living in the U.S. in 1970. Since 1990, the Nicaraguan-origin population in the United States nearly doubled, growing from 203,000 to 381,000.18
The Sandinista revolution that started in the mid-1970s and the Contra War that followed brought the first large waves of Nicaraguan refugees into the United States. The immigrants included wealthy landowners and business leaders as well as blue-collar workers. Their motivations, like most immigrants, was to escape economic difficulties, political chaos, and persecution.19 The current political crisis and resultant violence in Nicaragua are driving more immigrants to the United States.20
Most Nicaraguans live in Florida and California. About 40 percent of the 8,000 Nicaraguans in New Jersey live in the archdiocese of Newark. Approximately 45 percent of them live in Hudson County. About half of Nicaraguans identify as Catholics.
Nicaraguans in New Jersey
| 1990 NJ | 2000 NJ | 2010 NJ | 2010 RCAN | 2017* NJ | 2017* RCAN | |
|---|---|---|---|---|---|---|
| 4,326 | 4,384 | 8,222 | 3,495 | 9,026 | 3,937 |
Nicaraguans in the Archdiocese of Newark
| Bergen | Essex | Hudson | Union | RCAN | ||
|---|---|---|---|---|---|---|
| 2010 | 540 | 560 | 1,564 | 831 | 3,495 | |
| 2017* | 451 | 1,091 | 1,237 | 1,158 | 3,937 |
Decennial dates are Official United States Census
*United States Census Bureau Estimate
Costa Rica
The Costa Rican population in the United States at the 2010 Census was 126,418. Because of relative economic prosperity and political stability, there never has been a very large migration from Costa Rico to the United States.21
After California and Florida, New Jersey has the largest number of Costa Ricans in the United States. Slightly more than one-third of the almost 20,000 Costa Ricans in New Jersey live in the archdiocese of Newark. Almost half of those in the archdiocese live in Union County. Cities with a significant Costa Rican Population are Summit, Elizabeth, and Newark.
Costa Ricans in New Jersey
| 1990 NJ | 2000 NJ | 2010 NJ | 2010 RCAN | 2017* NJ | 2017* RCAN | |
|---|---|---|---|---|---|---|
| 4,925 | 11,175 | 19,933 | 7,001 | 20,900 | 7,401 |
Costa Ricans in the Archdiocese of Newark
| Bergen | Essex | Hudson | Union | RCAN | ||
|---|---|---|---|---|---|---|
| 2010 | 1,345 | 1,638 | 818 | 3,200 | 7,001 | |
| 2017* | 1,667 | 1,867 | 963 | 2,904 | 7,401 |
Decennial dates are Official United States Census
*United States Census Bureau Estimate
Panama

In the 2010 census, there were 165,456 Panamanians in the United States, only 5,431 in New Jersey. Almost half of the Panamanians in New Jersey live in the archdiocese of Newark. They are spread evenly throughout the four counties of the archdiocese. Approximately 70 percent of Panamanians are Roman Catholic. Panama has the highest per capita income of any country in Latin America. 22 This partially accounts for the comparatively small number of migrants.
Panamanians in New Jersey
| 1990 | 2000 | 2010 NJ | 2010 RCAN | 2017* NJ | 2017* RCAN | |
|---|---|---|---|---|---|---|
| 2,937 | 3,021 | 5,431 | 2,286 | 6,876 | 2,984 |
Panamanians in the Archdiocese of Newark
| Bergen | Essex | Hudson | Union | RCAN | ||
|---|---|---|---|---|---|---|
| 2020 | 438 | 626 | 698 | 474 | 2,286 | |
| 2017* | 714 | 645 | 1,016 | 609 | 2,984 |
Decennial dates are Official United States Census
*United States Census Bureau Estimate
Other Hispanic Communities
The following table illustrates the growth of the Hispanic community in the State of New Jersey and in the Archdiocese of Newark.
| 1970 | 1980 | 1990 | 2000 | 2010 | 2017* | |
|---|---|---|---|---|---|---|
| Bergen | 28,514 | 49,776 | 91,377 | 145,281 | 176,933 | |
| Essex | 76,584 | 97,777 | 122,347 | 159,117 | 179,661 | |
| Hudson | 145,163 | 183.465 | 242,123 | 267,853 | 293,465 | |
| Union | 40,756 | 67.797 | 103,011 | 146,704 | 171,169 | |
| Total RCAN | 291,017 | 398,815 | 558,858 | 718,955 | 821,248 | |
| Total NJ | 310,476 (4.3%) | 491,833 (6.7%) | 739,861 (9.6%) | 1,117,191 (13.3%) | 1,555,144 (17.7%) | 1,764,520 (19.7%) |
The following table indicates smaller groups of South American Hispanics for whom we do not have county breakdowns.
| 1970 | 1980 NJ | 1990 NJ | 2000 NJ | 2010 NJ | 2010 RCAN | |
|---|---|---|---|---|---|---|
| Total NJ | 7,71,112 | 7,365,011 | 7,730,188 | 8,414,350 | 8,791,894 | 2,859,650 |
| Hispanic | 288,488 | 491,883 | 739,861 | 1,117,191 | 1,555,144 | 718,955 |
| Argentinian | 8,023 | 7,795 | 14,272 | 2,262 | ||
| Bolivian | 1,755 | 3,361 | 550 | |||
| Chilean | 4,955 | 5,129 | 8,100 | 1,109 | ||
| Paraguayan | 803 | 1,964 | 85 | |||
| Uruguayan | 4,079 | 10,902 | 570 | |||
| Venezuelan | 2,185 | 3,962 | 6,950 | 877 | ||
| Other S.A. | 6,908 | 5,355 | 1,688 | 178 |
«IV. The Second Wave and The Great Hispanic Migration and Immigration Part One« : »VI. Asia / Korea»
Footnotes
- https://www.nj.com/news/2018/09/unauthorized_immigrant_nj.html
- “Preview of Research Findings October 22: Dominican Immigration Through Ellis Island – CUNY Dominican Studies Institute News”. Cunydsi.typepad.com. Retrieved 17 March 2015. https://www.everyculture.com/multi/Bu-Dr/Dominican-Americans.html#ixzz5bvwNSmLH
- Luis E. Guarnizo, “Los Dominicanyorks: The Making of a Binational Society,” in Annals of the American Academy of Political and Social Science, Volume 533, 1994, p. 71.
- Ruben G. Rumbaut, “The Americans: Latin American and Caribbean Peoples in the United States” in Americas: New Interpretive Essays, p. 288.
- https://www.nj.com/news/index.ssf/2011/05/new_us_census_figures_show_mex.html
- U.S. Census 2010.
- 2018 U.S. Census Estimate.
- https://en.wikipedia.org/wiki/Ecuadorian_Americans
- U.S. Census 2010.
- New Jersey Herald. “New Jersey’s Peruvians in the spotlight,” Sep. 19, 2009
- https://photos.state.gov/libraries/amgov/133183/english/P_20120824_AMComm_Peruvians_English.pdf. State Department, American Communities. Hudson County, Peruvian Americans.
- Migration Policy Institute. https://www.migrationpolicy.org/article/central-american-immigrants-united-states-1; https://www.pewhispanic.org/2017/12/07/rise-in-u-s-immigrants-from-el-salvador-guatemala-and-honduras-outpaces-growth-from-elsewhere/
- Salvadoran Americans, https://en.wikipedia.org/wiki/Salvadoran_Americans
- Guatemalan Americans. https://en.wikipedia.org/wiki/Guatemalan_Americans
- Guatemalan Americans. https://en.wikipedia.org/wiki/Guatemalan_Americans
- Honduran Americans. https://en.wikipedia.org/wiki/Honduran_Americans
- Pew Research Center Hispanic Trends September 10, 2015. https://www.pewhispanic.org/2015/09/15/hispanics-of-honduran-origin-in-the-united-states-2013/
- Pew Research Center Hispanic Trends, September 15, 2015. https://www.pewhispanic.org/2015/09/15/hispanics-of-nicaraguan-origin-in-the-united-states-2013/
- Nicaraguan Americans. https://en.wikipedia.org/wiki/Nicaraguan_Americans
- https://www.pri.org/stories/2018-09-24/violence-drives-increasing-numbers-nicaraguans-us
- Costa Rican Americans. https://en.wikipedia.org/wiki/Costa_Rican_Americans
- https://www1.cbn.com/cbnnews/world/2014/july/panama-immigrants-flood-to-us-for-surprising-reason