Data is fun! Excel is a friend with wonderful shortcuts! Those words have been rarely if ever uttered in the English language but it’s actually true in a way. As the merits and cons of using Excel has been reported before in the blog, I figured it is good to carry on that tradition. Working with self-reported data in this study is an experience that I can ever forget and I believe I can say the same for my fellow student researchers’. The data that we worked with provides insight into how people come into contact with various languages through their life experiences. It’s intimate in its own way as you really get to see and understand people’s lives and shared stories.
But then comes the transcribing and coding part of research which is an interesting ride on its own. You see, Excel, our primary mode of transferring the data on flashcards, is a very handy tool but we had to make sure that ALL the data was copied over.
Since our classmates were self-reporting the languages they knew, the scope of their knowledge with those languages, and how they came into contact with what they know, we had to copy everything, word for word. This included misspellings and grammatical errors as it was all self-reported data. Now since we had a huge set of data to enter in, we needed shortcuts to help us speed up the process. For example, clicking and dragging down cells for a whole entire column to show the exact same information, like indicating the individual data came from Intro. to Linguistic Anthropology Fall 2017, was extraordinarily helpful.
As was mentioned in past blog posts, its also helpful that Excel can be uploaded and converted to a Google sheet, making our data accessible to all of our research team who can contribute their own data sets and make corrections on a shared file.
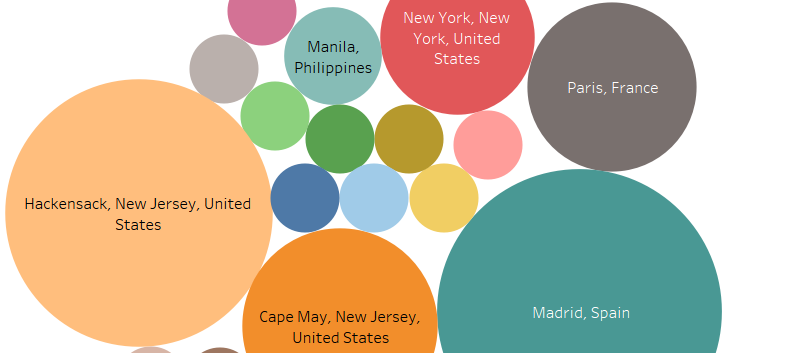
With this pooling together of each of our data sets and combined work, we can see interesting trends in our numbers, such as results written about here from past research.
I must admit that from this research my view of data has changed. It appears to me that individuals’ data are like different colors of paint and when all the sets are combined, they make an illustrious painting that you never expected to see. So I stand by my first statement; data is fun!