
A growing understanding of genetic variation both between histologically similar tumors from different patients and within individual tumors themselves is shedding light on the difficulties in treating cancer and developing biomarkers to diagnose it. It has long been known that a single tumor displays differences in morphology, nuclear shape, proliferation, and proportions of constituent cell types. However, these differences may be only be the “tip of the iceberg” as vast genetic and epigenetic variations that underlie them have been discovered between and within tumors.
The importance of inter- and intra-tumor genetic heterogeneity
Inter-tumor genetic heterogeneity, genetic differences between tumors of the same tissue type, leads to different responses of histologically similar tumors treated in the same way. Intra-tumor genetic heterogeneity refers to the presence of different genotypes of clones present within the same tumor.
Cancer cells are genetically, epigenetically, and post-translationally different from one another. These differences, give rise to an adaptive, evolving cancer phenotype. This adaptive cancer phenotype may lead to drug-resistance and clinical relapse. Furthermore, molecular diagnostics that seek to identify driver mutations and biomarkers within a tumor biopsy may be impeded by the presence of several potential driver mutations in the sample. Conversely, focusing on a single driver mutation may oversimplify the genetic landscape of a cancer cell population by ignoring low frequency mutations that have the potential to emerge as driver mutations. As such, therapies guided by these analyses, may be misdirected towards a target that is not shared by all tumor cells or these therapies may be exploited by genetically distinct clones that are more “fit” in the post-treatment microenvironment. This blog will focus on intra-tumor genetic heterogeneity, using species-level evolution as an analogy for cancer cell evolution.
Linear versus branched evolution of cancer cells
Recent research suggests that rather than evolving linearly as a series of successive mutations that eventually result in malignancy, tumor cells undergo branched evolution. A branched model of tumor evolution (Fig. 1a) may explain the degree of intra-tumor heterogeneity that has been observed in various cancer types. In this model, the “trunk” represents the gene profile that is shared by all clones of the primary tumor, containing one or more driver mutations. As the tumor progresses temporally and spatially (within the primary site and in metastatic locations), distinct subtypes of the primary tumor emerge as “branches” of the tree. These “branch” clones share increasingly less genotypic features with the primary tumor, and contribute to the overall genetic variation within the tumor.
Branched tumor evolution is directly analogous to species-level evolution (Fig. 1b). Just as a human shares more genetic similarities with a mouse than a fish, tumor clones within the same branch share more genetic similarities with each other than with clones in a different branch. Additionally, the branch points of tumor evolution represent moments and/or areas of selective pressure exerted on the tumor by its microenvironment and/or treatment. Selective pressure may come from scarcity of nutrition, hypoxia, cancer treatment, or immune cells. Independently or synergistically, these forces shape the cancer gene pool, and drive tumor evolution by selecting for the fittest clone. Subsequently, the selected clone experiences less selective pressure and is able to establish a new “branch” of cells. Here again this model displays obvious parallels with the evolution of a species being driven by environmental pressures.
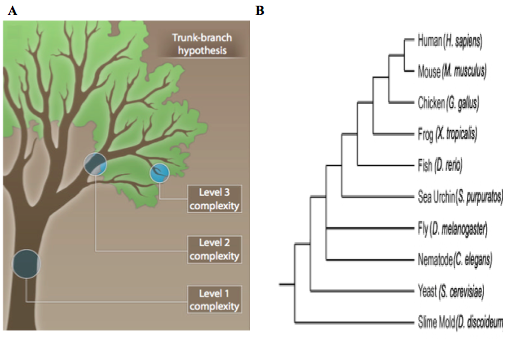
Figure 1: Branched tumor evolution mimics species evolution. A) A branched model for tumor evolution. The trunk of tree represents gene expression features shared by all descendant clones. The initial driver mutations are present in this first level of complexity. The branches (2nd and 3rd levels of complexity) represent increasingly heterogeneous clones, which harbor passenger mutations that may become driver mutations following selective pressure. (Modified from Yap et al., 2012). B) Phylogenic tree of several modern species. Branched cancer evolution parallels the evolution of a species. (Modified from Zaidel-Bar, 2009). http://www.ncbi.nlm.nih.gov/pubmed/22461637 and https://openi.nlm.nih.gov/detailedresult.php?img=PMC2728394_JCB_200811067_LW_Fig1&req=4
Implications of tumor heterogeneity on biomarker-directed therapy
The heterogeneity of cancer genotypes within a single tumor (or between a tumor and metastatic locations) can lead to spatial and/or temporal sampling bias during tumor biopsies. This is because the genomic, transcriptomic, and proteomic profile of tumor cells in one region or at one time may be divergent from tumor cells in different regions or at different time points. Therefore, a treatment based on the identification of a robust biomarker from a single biopsy may not be efficacious across the entire tumor or course of treatment. One study demonstrates how a single tumor biopsy may miss “private” mutations that are not shared by all tumor cells. The authors sequenced eight samples of the primary kidney tumor along with three metastatic samples (Fig. 2). They found that a single inactivating mutation to the tumor suppressor von Hippel-Lindau (VHL) gene was shared by all samples. However, the mutational profile of the primary samples diverged from the mutational profile of the metastatic samples. Furthermore, within each one of these subpopulations, the individual biopsies were divergent from one another (Fig. 3). If, in treating this patient, the therapy was determined solely by the most frequent mutation, it would be aimed at compensating for the loss of VHL. However, a therapy such as this may allow cancer cells harboring additional low frequency advantageous mutations to exploit the post-treatment tumor microenvironment.
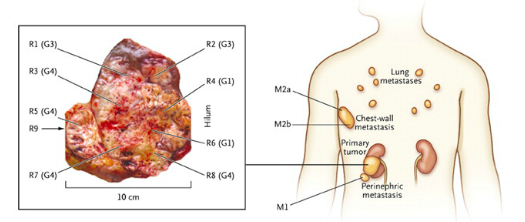
Figure 2: Regions of biopsies sampled from the primary kidney tumor (marked as R) and metastatic locations (marked as M). (From Gerlinger et al, 2012). http://www.nejm.org/doi/full/10.1056/nejmoa1113205#t=article
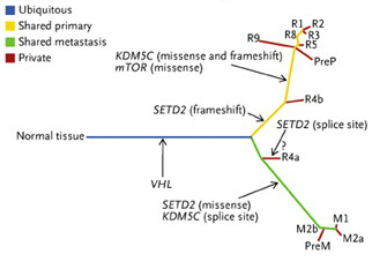
Figure 3: Genetic divergence across the biopsies taken in Fig. 2. The trunk of this tree is an inactivating mutation to the VHL gene, which is shared by all cancer cells. The lower green branch represents mutations to the SETD2 and KDM5C genes which are shared by all metastatic samples. The upper yellow branch represents a mutation to mTOR as well as differently-mutated SETD2 and KDM5C, which are shared by all primary tumor samples. The red lines represent mutations that are unique to that sample. All lines are proportional to the amount of genetic difference separating that sample from its parental branch. (From Gerlinger et al, 2012). http://www.nejm.org/doi/full/10.1056/nejmoa1113205#t=article
Cell sequencing of multiple cancer cells
Another study suggests that single cell sequencing of a cancer cells may provide a way to better evaluate the depth and width of mutations present in a tumor, and thus it would allow for more sensitive and effective treatment of genetically varied tumors. Researchers have used this technique to compare gene expression levels between single circulating tumor cells (CTCs) from the same patient or cell line. They showed that from a single cell perspective there is considerable heterogeneity between individual cells (Fig 4a). More importantly, by analyzing the data they gathered from single cells with bioinformatic software they were able to identify key pathways that were upregulated across all analyzed cells (Fig. 4b). While methods like this are currently laborious and expensive, treatment guided by this type of sensitive analysis could be more effective than treatment guided by currently-employed molecular diagnostics.
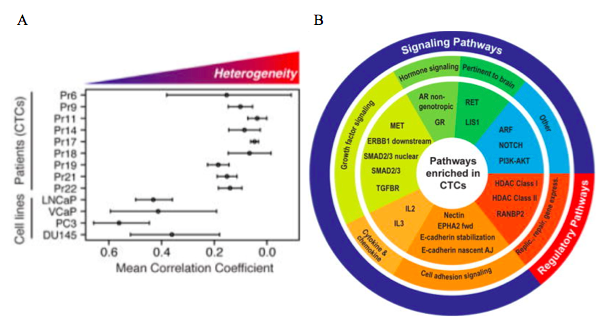
Figure 4: Single cell sequencing results. A) Correlation of expression levels between single circulating tumor cells and single cells from the same cell line. Heterogeneity between single circulating tumor cells within the same patient is higher than between single cells from the same cell line. B) Using bioinformatic software a graph of the key pathways that were upregulated in single cells can be constructed. (From Miyamoto et al, 2015). http://www.ncbi.nlm.nih.gov/pmc/articles/PMC4872391/#SD1