Terence K. Teo
Department of Political Science and Public Affairs
Data Narratives: Telling Stories from Data
The Seton Hall-Ramapo Digital Humanities Fellowship inspired me to create a new lecture on data visualization in my course on research methods (POLS 2910). In this course, students learn how to use the free and open-source statistical computing language, R, to download, read, transform, analyze, and visualize data. This new lecture emphasizes that charts are visual arguments and need to be read and interpreted by the individual, not merely seen. Consequently, our biases affect how we interpret these visual arguments—we tend to see what we want to see—yet any chart shows only what the designer wants to reveal and nothing else. That is, charts both show and hide. Well-designed and honest charts facilitate learning and conversations; badly designed ones lend themselves to misinterpretation and hinder these conversations.
To complement this new lecture, I added a capstone assignment—a reproducible data story, the goal of which is to have students find data of interest to them, and to pull together and apply the data visualization principles and coding skills they acquired over the course to create and craft at least three different charts that tell a story from the data. This assignment is a narrative which uncovers meaning and knowledge from data through the weaving of charts and prose. What is more, the use of code ensures that student projects are reproducible—I (and anyone else) can recreate the charts to ensure data and scientific fidelity, an important aspect of the (social) scientific enterprise. I am pleased that many students were excited at the prospect of being able to work on a project they care about, and to create a piece of work that showcases their skills.
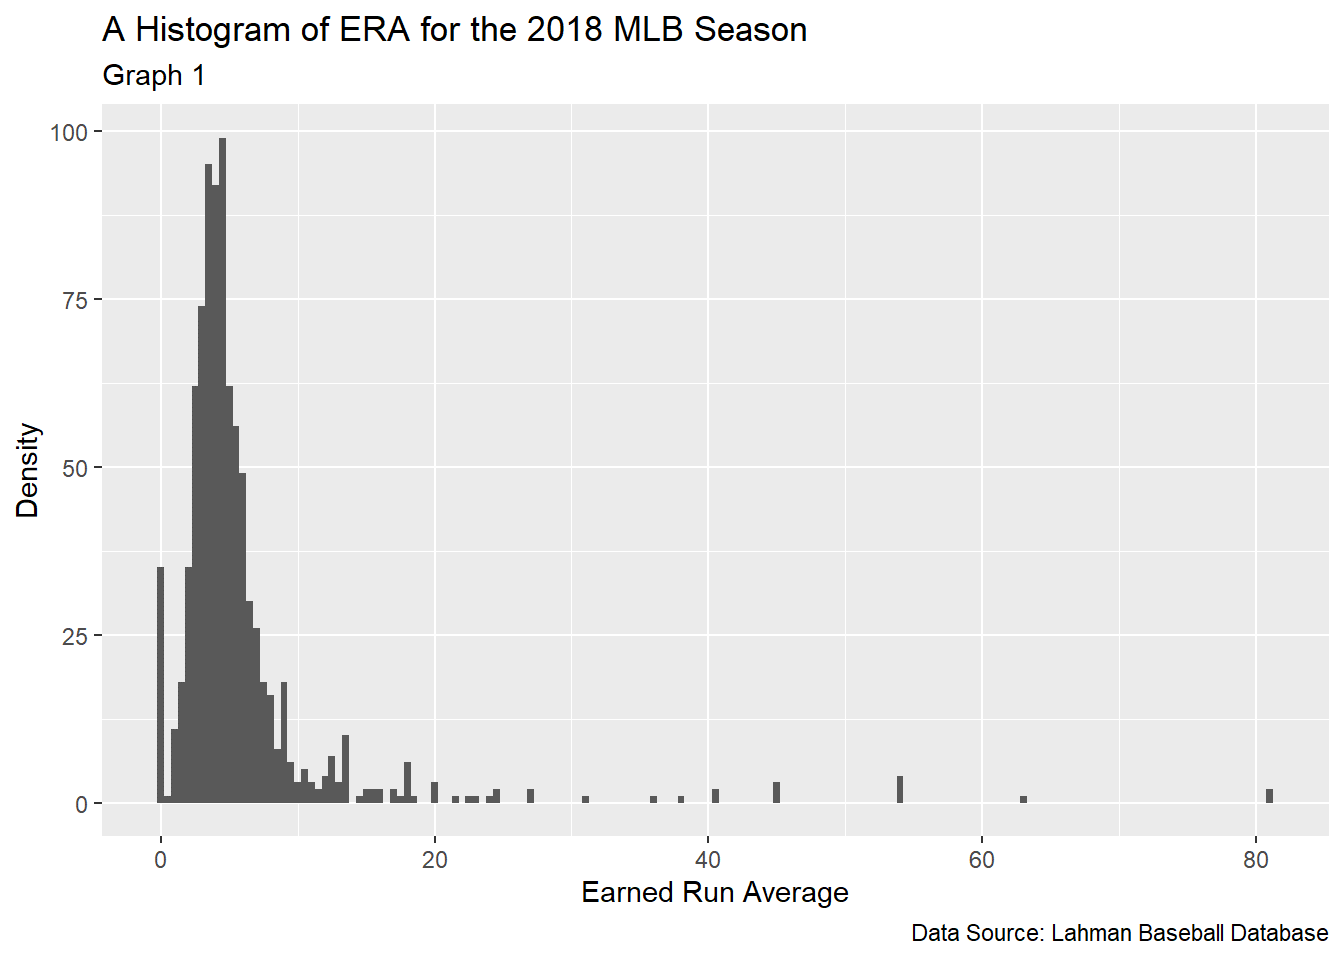
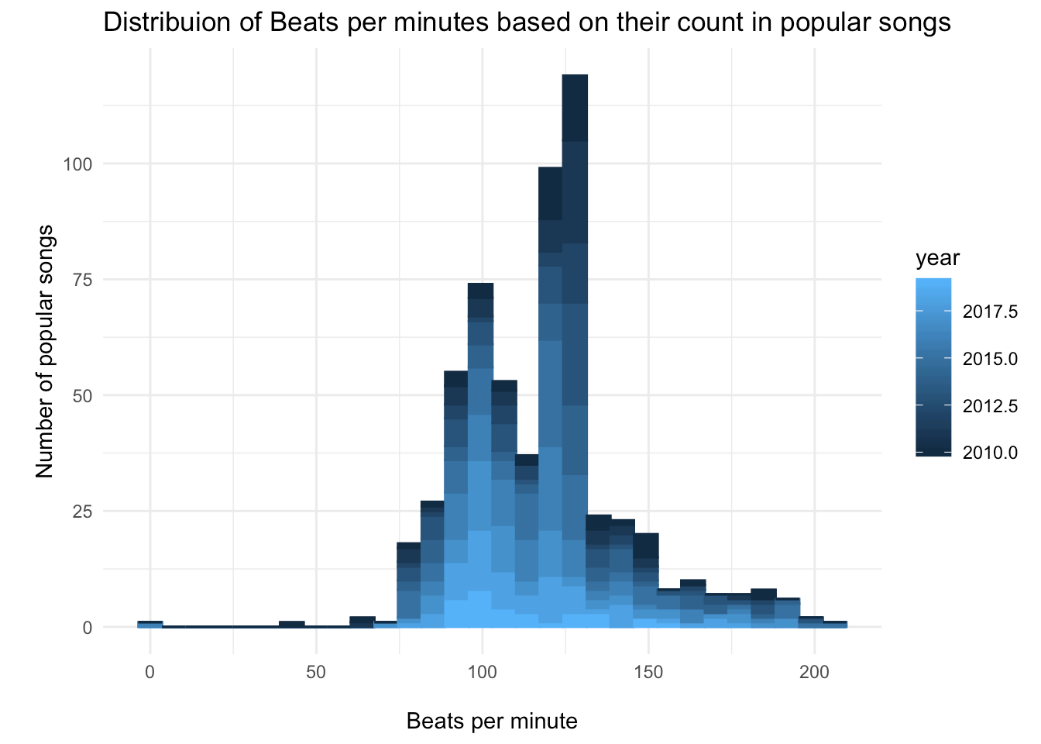
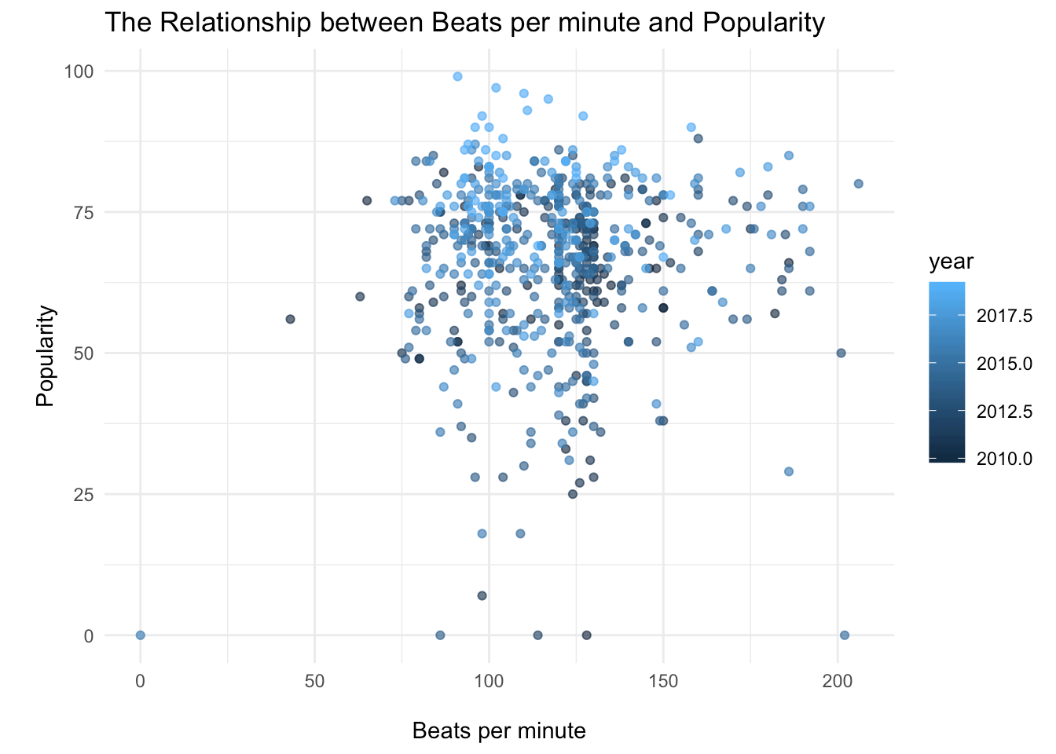
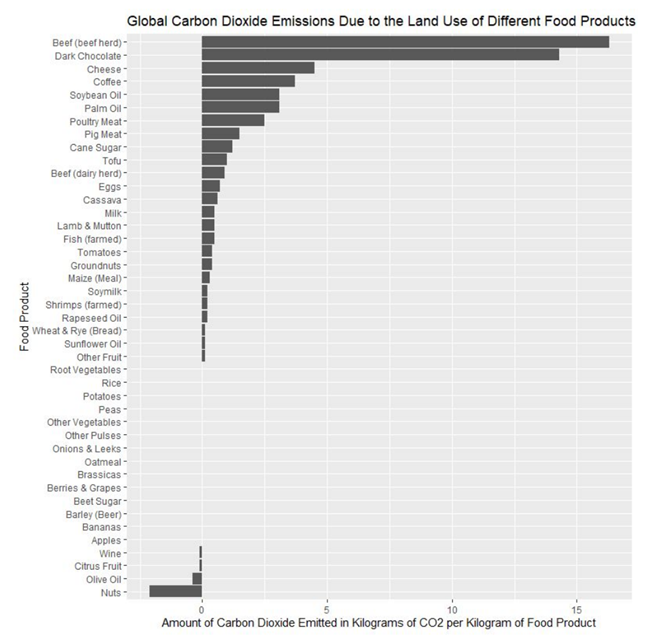
I highlight here work by four students, with topics ranging from baseball, music, climate change and agriculture, to politics.
The first is titled. “Can Old Guys Still Play?”
The second looks at how beats per minute affect a song’s popularity.
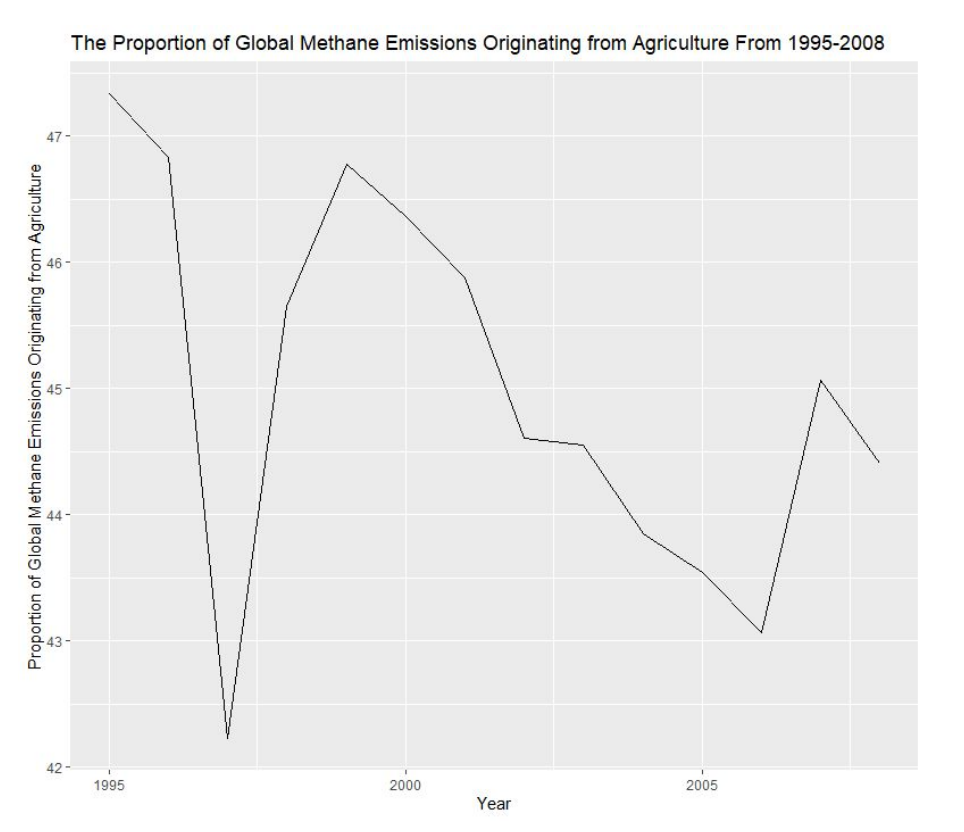
The third explores how meat consumption and production affects the environment.
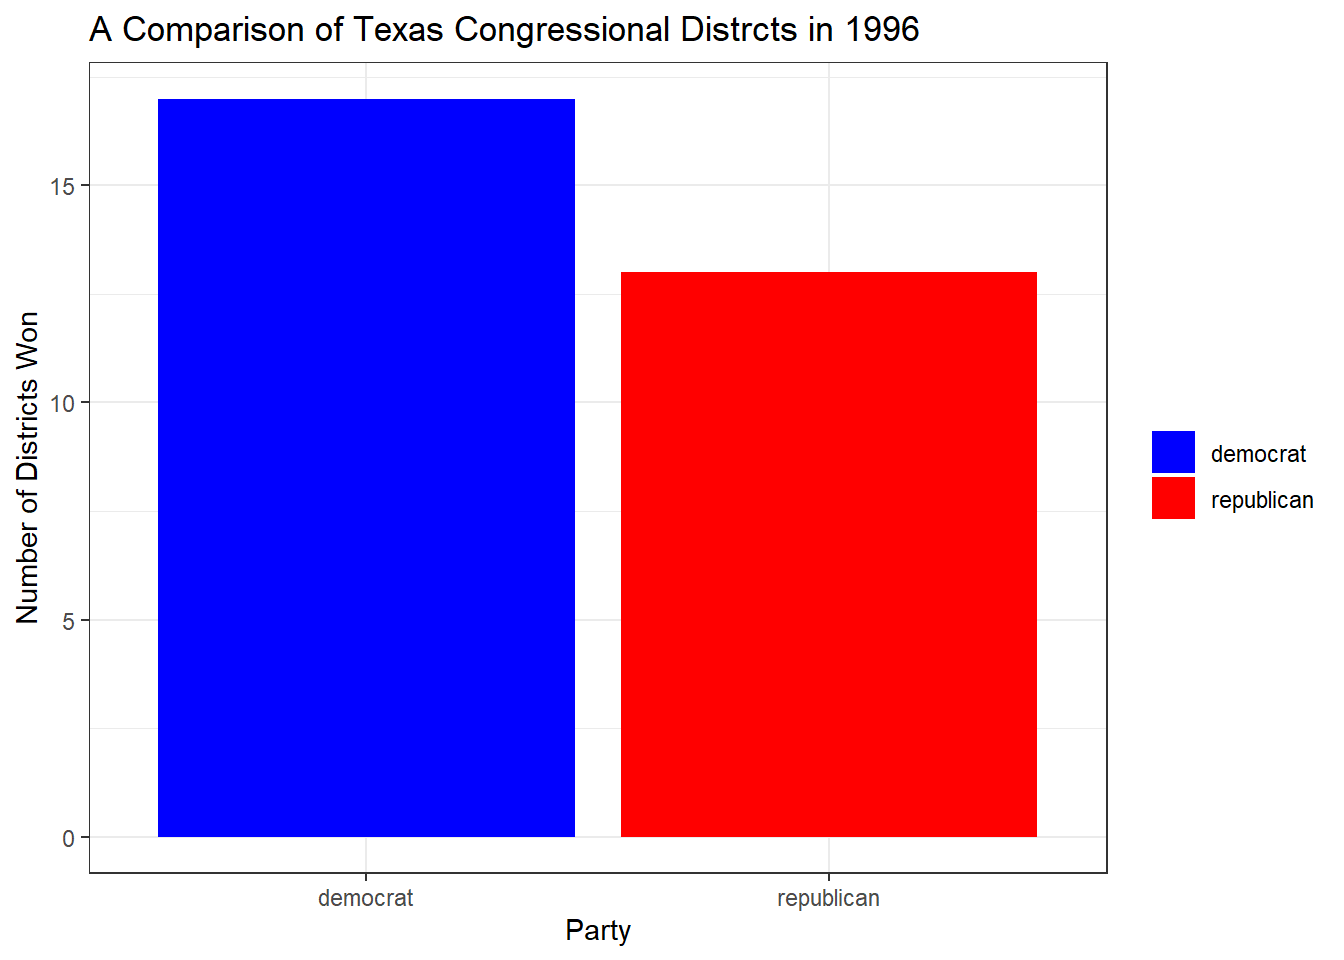
The fourth examines the effects of gerrymandering on voter turnout.
The heartfelt comments that I received at the end of the semester are what make teaching such a rewarding and fulfilling endeavor, and this assignment will be a staple in future iterations of the course.
