Is the Stock Market Overvalued?
Aidan Griffin
Staff Writer
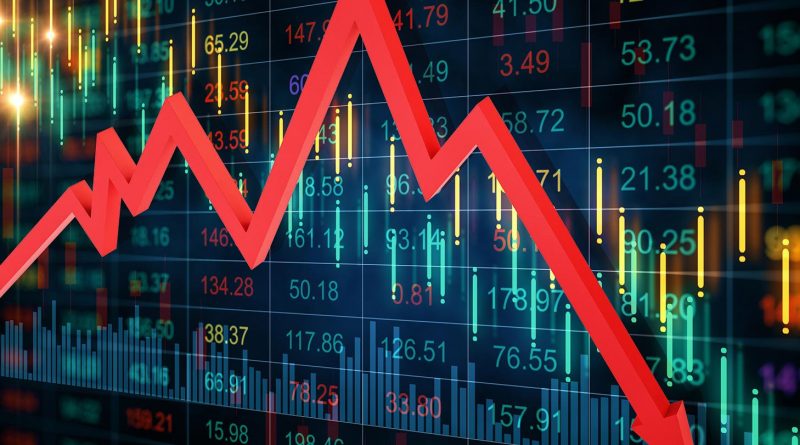
The stock market has done exceptionally well this year, with the S&P 500 returning 22% compared to a historical average return of 12%. This leads many investors to the question, whether the stock market is overvalued?
In this article, we will examine the stock market’s relative cost using Price to Earnings and Price to Cash Flow ratios and compare the current ratios with the average historical ratios.
For our analysis, will will compare the historical averages of the S&P 500 index which tracks the performance of the top 500 publicly traded American companies. The S&P 500 represents a broad American market and is used by analysts and to determine how the stock market is performing in overall.
Price to Earnings Ratio
An important indicator of a stocks relative performance is its Price-To-Earnings Ratio (PE), which indicates a company’s market price relative to its most recent earnings. To illustrate it better, here is an example: “If investors buy 1 share of Apple for $100, and Apple consistently makes profits of $10 per-share, each year, then it follows that it would take the investor 10 years to earn back their original $100 investment.” This means that investors want a low PE ratio compared to its historical average when buying a stock.
Analysts compare company’s current Price-to-Earnings ratio to its historical ratios, as well as the industry average ratios to identify whether the stock is overvalued or undervalued relative to its historical valuations. A PE ratio that is higher than the industry average or its historical average likely indicates that the stock may be overvalued. Young, fast growing companies or a “booming” industry create high inflated PE Ratios which is an indicator that the stock may be risky or overvalued. More conservative investors prefer to invest in larger, less volatile company stocks with lower P/E ratios.
The S&P 500 historical PE average from the last 10 years is 16.9 while its current PE ratio is 27.9, which is significantly higher. This extremely high increase in PE ratios means that the market is possibly overvalued because a current PE ratio of 27.9 is much higher and not in line with historical PE ratios of 16.9. Investors want a low PE ratio, the higher it is, the longer it will take for a return on investment.
Price to Cash Flow Ratio
Another important indicator of a stocks relative performance is in its Price to Cash Flow (P/FCF). The price-to-cash-flow ratio is used by analyst to measure the price of a company’s stock relative to how much cash flow it generates. This means that P/FCF shows us how well a company is using its money. Investors want the P/FCF ratio to be low because this signals that the company is generating strong free cash flow relative to its market price, as a result suggesting financial stability.
The S&P 500 historical P/FCF ratio average over the 20 years is 20.5, while the current P/FCF ratio is 30.1. Having a current P/FCF ratio of 30 means that investors are willing to pay $30 for every $1 of annual cash flow that the S&P 500 generates. A high P/FCF Ratio compared to its historic average is a possible indicator that a company’s stock is overvalued. This means that when a company has a low P/FCF they are undervalued and when a company has a high P/FCF they are overvalued because investors end up paying more for each dollar of free cash flow.
Is now a good time to invest in the stock market?
While the S&P 500 showed a 22% gain in 2024, many investors are thinking if they should buy more, hold, or sell. Given unpredictable market conditions, it is hard to say, however, looking at PE and P/FCF Ratios, it is most likely that the S&P 500 is overvalued. However, while the market holds momentum, the S&P 500 has a potential to increase, despite the current ratios signifying that investors are paying more for a company relative to its earning than ever before in history.
Contact Aiden at Aidan.Griffin@student.shu.edu