World Bank Maps Tool Available for Research

Directly from the World Bank website, Seton Hall students and faculty can visualize and investigate data through World Bank Maps, an interactive map tool that allows users to browse World Bank projects and datasets.

This resource could aid the research process of several students and faculty at Seton Hall, especially at the School of Diplomacy.

The map tool offers several features for its users, including a project function that provides a global overview of World Bank developmental projects, with a breakdown for each country that details the amount of projects as well as total investment amounts.

Additionally, an option to check projects related to COVID-19 response efforts is available for those interested.

Besides project data, the mapping tool offers access to 1450 World Bank datasets that can be added as a map layer for data visualization purposes. The datasets cover a wide range of research topics, ranging from per capita income, education completion rates, labor market data, and several other indicators of human development.

Finally, the World Bank also offers a DataBank that students can use to search for time series data and use it to create visualizations, maps, and research reports. Directly from this tool, besides creating visualizations, users can check reports shared by other users.

SHU Data Services encourages students and faculty to check these datasets, as these tools may be a useful asset to your research needs. A user guide is available for the World Development Indicators.

For assistance with data visualization or questions on this map tool, please reach out to Data Services at data.services@shu.edu.


Upcoming Data Services Summer Classes

SHU Data Services Libraries is excited to announce upcoming Data Services classes, starting out next week. All students, staff, and faculty are welcome to attend sessions. Please see the schedule below or access the full calendar through this link.

July 6th, 2021, from 2:00-2:45 pm: Introduction to Stata

July 7th, 2021, from 10:00-10:45 am: Introduction to Jupyter

July 8th, 2021, from 2:00-2:45 pm: Find Data For Your Research in ICPSR

July 13th, 2021, from 10:00-10:45 am: Introduction to Microsoft Power BI

July 14th, 2021, from 2:00-2:45 pm: Qualitative Data Analysis in ATLAS.ti

July 15th, 2021, from 10:00-10:45 am: Research Data Management

July 20th, 2021, from 2:00-2:45 pm: Building Survey in Qualtrics

July 21st, 2021, from 10:00-10:45 am: Survey Research in Qualtrics

July 28th, 2021, from 2:00-2:45 pm: Data Analysis in SPSS

August 11st, 2021, from 10:00-10:45 am: Research Data Management

August 12nd, 2021, from 2:00-2:45 pm: StoryMaps in ArcGIS

August 31st, 2021, from 10:00-10:45 am: Research Data Management

To sign up for any specific section, click on the link of it and follow the registration prompts to receive your sign-up confirmation. For any questions, please reach out to SHU Data Services at data.services@shu.edu. Students, faculty, and staff with workshop suggestions are encouraged to reach out to Data Services.

Data Services Group

University Libraries launched its Data Services Group in Fall 2019.  Librarians and a Data Support Specialist are available to provide training in data management, specific tools like Stata, SPSS and R, Survey Research Methods for Qualtrics and Data Management for Seton Hall University students, faculty, staff, and administrators.  For further information, please view the Data Services website.  Part of the Data Service mission is to provide access to data sources including ICPSR.

SHU Data Services to Offer ArcGIS Licenses

University Libraries Data Services Logo

Seton Hall will now offer ArcGIS licenses for students and faculty. Through this geographic information system (GIS) tool, SHU users will be able to build maps, analyze data, and create visualizations based on their coursework or research needs. To request a license, please click on this link.

ArcGIS will be a powerful addition to the list of software tools offered at Seton Hall, as this tool is useful for various disciplines. ArcGIS allows its users to showcase and analyze any dataset that has a geographic component to it. For example, a student from the School of Health and Medical Sciences could use ArcGIS to present a visualization of the percentage of NJ adults that are smokers. Or, alternatively, a student of political science could create a map in ArcGIS to highlight counties in New York state with high levels of income inequality relative to the state average.

To create powerful visualizations and analysis, SHU users are encouraged to combined ArcGIS with StoryMaps, a web map account that combines graphs with text elements. This integration can be done directly from the ArcGIS account. To obtain information on ArcGIS training resources, please refer to this link or schedule a data consultation with SHU Data Services through this link.

On June 17th, Data Services offered a workshop on ArcGIS and StoryMaps during the Digital Humanities 2021 Summer Seminar. Those interested can obtain the recording of this workshop through this link. To stay updated on upcoming data classes this summer, please check the Data Services Class calendar.

Data Services Group

University Libraries launched its Data Services Group in Fall 2019. Librarians and a Data Support Specialist are available to provide training in data management, specific tools like Stata, SPSS, R, Power BI, Tableau, and Qualtrics for Seton Hall University students, faculty, staff, and administrators. For further information, please check the Data Services website. Part of the Data Services mission is to provide access to data sources including ICPSR.

SHU Data Services To Host June Seminar With Digital Humanities Committee

Previous Workshop ShownUniversity Libraries Data Services Logo

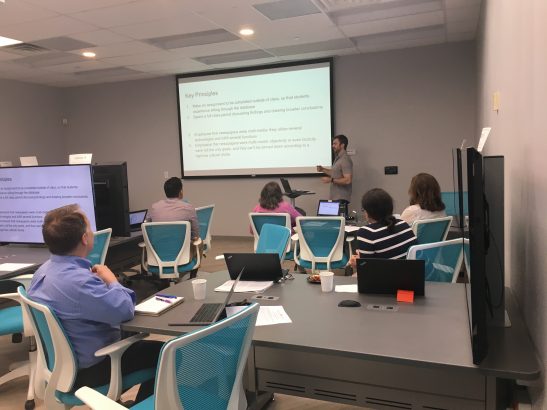
On June 17th,  Data Services and the Digital Humanities 2021 Summer Seminar will run a full-day of presentations and discussions. This full-day is designed to provide faculty with the 21st century skills needed to promote student engagement and critical thinking skills and to inspire creativity.  To attend any of the presentations, please use this link at the scheduled presentation time.

The Seminar will begin at 9AM, with a panel on the 21st Century Skills for faculty. In this panel, several faculty members from various departments will share their thoughts and experiences with digital skills. Panelists include Chelsea Barrett, Business University Librarian, Jonathan Farina from the English Department, Daniel Ladik from the Marketing Department, Michael Taylor from the Political Science Department, and Genevieve Zipp, from the Interpersonal Health Sciences and Health Administration Department. The recording of the panel is now available through this link.

At 10AM, SHU Data Services will cover data management and will target those interested in learning more about data workflow, metadata, digital preservation, and how to write a data management plan that meets federal guidelines. To obtain the recording of this session, please click here.

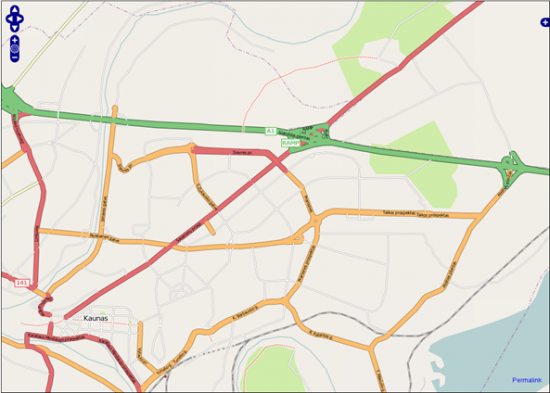
Shortly after, at 10:40AM, Data Services will begin its ArcGIS and StoryMaps program. In this workshop, the audience will learn how to combine ArcGIS and StoryMaps to create powerful customized maps to highlight the narrative behind datasets. The recording of this session is now available through this link.

Additionally, at 11:25AM, Data Services will start an overview session on Atlas.ti. This session will teach beginners users how to use this qualitative software tool to locate text, code information, and annotate your findings. To catch-up on this session, click here to watch it.

After these Data Services presentations, the full-day event will continue with various presentations covering other skills. From 1PM-1:20PM, Sara Fieldston from the History Department will present on WordPress’ student projects.

Following her presentation, Professor Greg Iannarella from the English Department will present on Sway and OBS at 1:25PM. He will discuss how students and faculty can use each tool for their coursework.

Afterwards, Dongdong Chen from the Languages, Literature, and Cultures Department will discuss Podcasting at 1:50 PM. Her presentation will cover how students can engage with class materials by using podcasts.

At 2:15PM, Rachel Warmington from the English Department will begin a presentation on MS Forms and Twine. The presentation will explain how students and faculty alike can use these tools to create digital stories.

Finally, at 2:40PM, Mary Balkun from the English Department will present on Scalar, an open-source publishing platform for essays and book-length projects.

To check on each of the sessions mentioned above, please check this link of the recording of all afternoon sessions.

To stay updated on future SHU Data Services programs, please visit the Research Data Services Blog for other updates. We expect to run more programs this summer. Finally, if you have any questions, please feel free to reach out to the Data Services team at data.services@shu.edu.

To remain up to date with the Digital Humanities Committee, please visit their website. Since 2015, the Committee promotes faculty development in digital humanity skills and tools. For more information, please contact Mary Balkun at mary.balkun@shu.edu or Marta Deyrup at marta.deyrup@shu.edu.

SHU Libraries Continues to Contribute to ICPSR

SHU Libraries is celebrating the three-year anniversary of the launch of its partnership with ICPSR, a consortium of institutions that collaborate to provide several data sources that individuals can leverage in their research process.

To take advantage of this consortium, Seton Hall students and faculty can create an account with their Seton Hall email to access the subscription content free of charge.

Among its advantages, ICPSR contains open-source data as well as datasets that less accessible without memberships or access privileges. The consortium covers a wide range of fields of study, such as business, health sciences, political science, nursing, communications, social work, psychology, economics, and much more. This large range of covered topics make ICPSR a valuable resource for various research projects conducted at Seton Hall and beyond.

In the ICPSR website, Seton Hall users can search for data based on topic, geography, studies, or even by different types of datasets. Additionally, there is an option to search for specific variables and compare these variables with other types of variables.

SHU Data Services strongly recommends the use of ICPSR for all students and faculty that may be experiencing difficulties in obtaining specific data sets or may be looking for additional resources to complement their existing research or literature review. ICPSR also offers cleaner versions of open-source data that can facilitate the research process.

For those interested in learning more about ICPSR or with questions about finding, collecting, or managing data, please reach out to the Data Services team at data.services@shu.edu.


SHU Data Services Joined Petersheim Exposition

SHU Data Services is excited to announce its contributions to the 25th edition of the Petersheim Academic Exposition.

On April 26th, Chelsea Barrett, along with other library faculty, led a presentation on library research support during the COVID-19 pandemic. This presentation included two testimonials of students that recently utilized Data Services consultations to facilitate their research. One of the students, a Ph.D. candidate in Health Sciences, noted that Data Services “has been helping me step by step…[making] the research journey (particularly the data analysis part) for Ph.D. students like myself, less intimidating/stressful, more enjoyable and even more exciting.”

Following this presentation, Lisa DeLuca and Luisa Chainferber also presented on Humanitarian Mapping at Seton Hall. In this presentation, the Data Services team covered how students and faculty can take advantage of humanitarian mapping opportunities to gain community service hours as well as a leisure activity. Additionally, the presentation covered the process to set up a HOT account with OpenStreetMap, mapping instructions, and information on the characteristics and use cases of GIS data.

Lastly, the SHU Data Services team offered a PowerBI workshop on how to take your report to the next level on April 28th. In this workshop, Luisa Chainferber covered how to create visuals in PowerBI, how to add a custom background, how to add and hide data filters, and how to connect multiple pages of a report. Through these steps, participants learned how to create more user-friendly and interactive reports.

SHU Data Services is now looking forward to the next edition of Petersheim. To access any recordings or presentation materials from this year, please contact data.services@shu.edu.


Seton Hall To Begin Humanitarian Mapping

Seton Hall University Libraries is excited to announce that students can now join Humanitarian Mapathons—coordinated mapping events with a humanitarian purpose, such as the mapping of areas that are highly subject to natural disasters—as another community service opportunity at Seton Hall.

With an OpenStreetMap and a Humanitarian OpenStreetMap Team account (HOT), students will be able to volunteer in humanitarian mapping activities along with a group leader. Group leaders will be able to select regions of the world that lack mapping data and coordinate so that students can collaborate virtually for map completion. Additionally, students will be able to check on their individual contributions by accessing the “My Contributions” tab in their personal accounts.

On March 5th, the Diplomacy Leadership Cohort participated in the first SHU humanitarian mapping session. Lauren Diawatan, a Diplomacy undergraduate student, joined the session and later said that humanitarian mapping helped her make a difference. She also noted that she never realized before “how online mapping could make an impact on directing resources and assistance.”

Besides its humanitarian purpose, humanitarian mapping also has the added benefit of enhancing students’ digital literacy, which makes this service opportunity a perfect fit for classes that seek to discuss the ethical, economic, or legal issues surrounding open-source data. As explained in Bloomberg, the access to geospatial data before OpenStreetMap was difficult and significantly limited to government agencies, however, nowadays, there is already more than five million registered users that can contribute to mapping several parts of the world.

Faculty and students who are interested in running or participating in a Mapathon can reach out to Lisa DeLuca at lisa.deluca@shu.edu  with inquiries or requests.

Data Services Group

University Libraries launched its Data Services Group in Fall 2019.  Librarians and a Data Support Specialist are available to provide training in data management, specific tools like Stata, SPSS and R, Survey Research Methods for Qualtrics and Data Management for Seton Hall University students, faculty, staff, and administrators.  For further information, please view the Data Services website.  Part of the Data Service mission is to provide access to data sources including ICPSR.


SHU Data Services Group Hosted 2021 Love Data Week

Seton Hall University Libraries’ new Data Services Group, hosted its Love Data Week 2021 virtually this February 8th-12th. This year’s theme for the LDW at SHU was “Diversity and Inclusion in Data.”

During the week, the Data Services Group offered several sessions, ranging from Tableau Dashboards, Using Power BI to Identify Diversity in Your Workplace, Using Excel to Build an Optimal Investment Portfolio, and much more. The sessions counted with high levels of participation from University Libraries staff, SHU faculty & administrators, external guests, as well as undergraduate and graduate students.

Additionally, thanks to the University Libraries’ partnership with ICPSR, an international consortium that allows SHU students and faculty to access several secondary datasets, Love Data Week even had international attendees join its session on Diversity, Equity and Inclusion on data sources. The session described how students can use ICPSR to discover data sources related to several communities.

Joseph Kajon, a sophomore Mathematics major, said he really enjoyed the experience of attending the Tableau Dashboards session. “As someone interested in the field of Data Science, I really appreciate having these resources available to learn more about how to efficiently use data.” He also added that he enjoyed “seeing how data is relevant to all fields, not just STEM related. Overall, LDW was a great experience and strengthened my interest in data.”

Faculty and students who were unable to attend the sessions can assess the recordings and presentation materials below. All are encouraged to learn about Research Data Services now offered by University Libraries, including data management, collection, and storage options. In addition, SHU students and faculty can request software access to aid their research based on the list of software supported at SHU in the Data Services Guide.

R: ggplot |Recording | Presentation

Using PowerBI To Identify Diversity in Your Workplace | Recording | Presentation

Using Excel to Build an Optimal Investment Portfolio| Recording

Diversity, Equity and Inclusion Data Sources in ICPSR | Recording | Presentation

Algorithm Bias and Data Ethics | Recording | Presentation

Tableau Dashboards | Recording

Data Narrative Assignment Workshop | Recording | Presentation

Facts & Figures Zet Forward | Recording | Presentation

Douglass Day Conversations| Presentation

For future workshops, stay connected with us and be sure to check the Data Services Group’s Class Calendar.