This year’s Visualized conference happened Thursday, October 6, at The New School in New York. We had a full day of presentations by leaders in the field, and some of them were really inspiring. Here’s a few of the best.
Nick Felton
Pictures, Not Pixels
Nick became well-known in the businesses by his “annual reports.” These were structured like the traditional corporate annual report, only they contained data like what music he listened to, how many Facebook posts he made, how many pieces of snail-mail he received.
In his presentation, Nick discussed using photos as an elemental unit, and not data rows. Photos, he believes, are the bookmarks of our lives. Many photo apps for our phones and other devices provide automatic curation as well.
Some of the techniques he discussed that add depth and meaning included the usual stop-motion, multiple exposure and long-exposure techniques. But also motion blurs, superimpositions, channel-splitting (using the CMYK or RGB channels of a digital image in different ways), averaging, slit-scans, mosaics and data-infused photos.
Examples can be found in his book “Photoviz” (I have a copy if you want to take a look)
Adam Jenkins
Framestock Labs
Adam’s firm does film animation and effects. One of their local projects is the series of video screens on the facade of Morgan Stanley’s headquarters in Times Square.
From an educational point-of-view, their virtual reality Field Trip To Mars is very interesting. A school bus was outfitted with flat-screen panels instead of windows, and photos from Mars rovers where stitched together to give a real-time view of what driving across the surface of the red planet would be like.
The view out the window moved at exactly the same speed that the bus was traveling, and when the bus turned a corner so did the viewpoint of the passengers.
Ingrid Burrington
Networks of New York
Ingrid explores the physical infrastructure of the city — its maze of fiber-optic cables, gas mains, sewer pipes, subway lines and roads. Her book is a “field guide” to the city, unlocking some of the codes to further understanding.
Tom Duscher
SciCom Labs
Tom’s firm undertook a way to make the usual scientific/educational poster presentation more interactive. A version of the presentation on tsunamis is here.
Eric Rodenbeck
Map of Emotions/Emotional Map
Eric worked with psychologist Dr. Paul Edkman and the Dalai Lama to use the science of emotions to present a visual tool to improve understanding. The results, The Atlas of Emotions, are very beautiful, as well as being interesting.

Each “continent” leads you to a page that maps various degrees of each emotion, along with triggers and outcomes. I found it to be a rather insightful way of doing a data visualization of something that is much more subjective than just numbers.
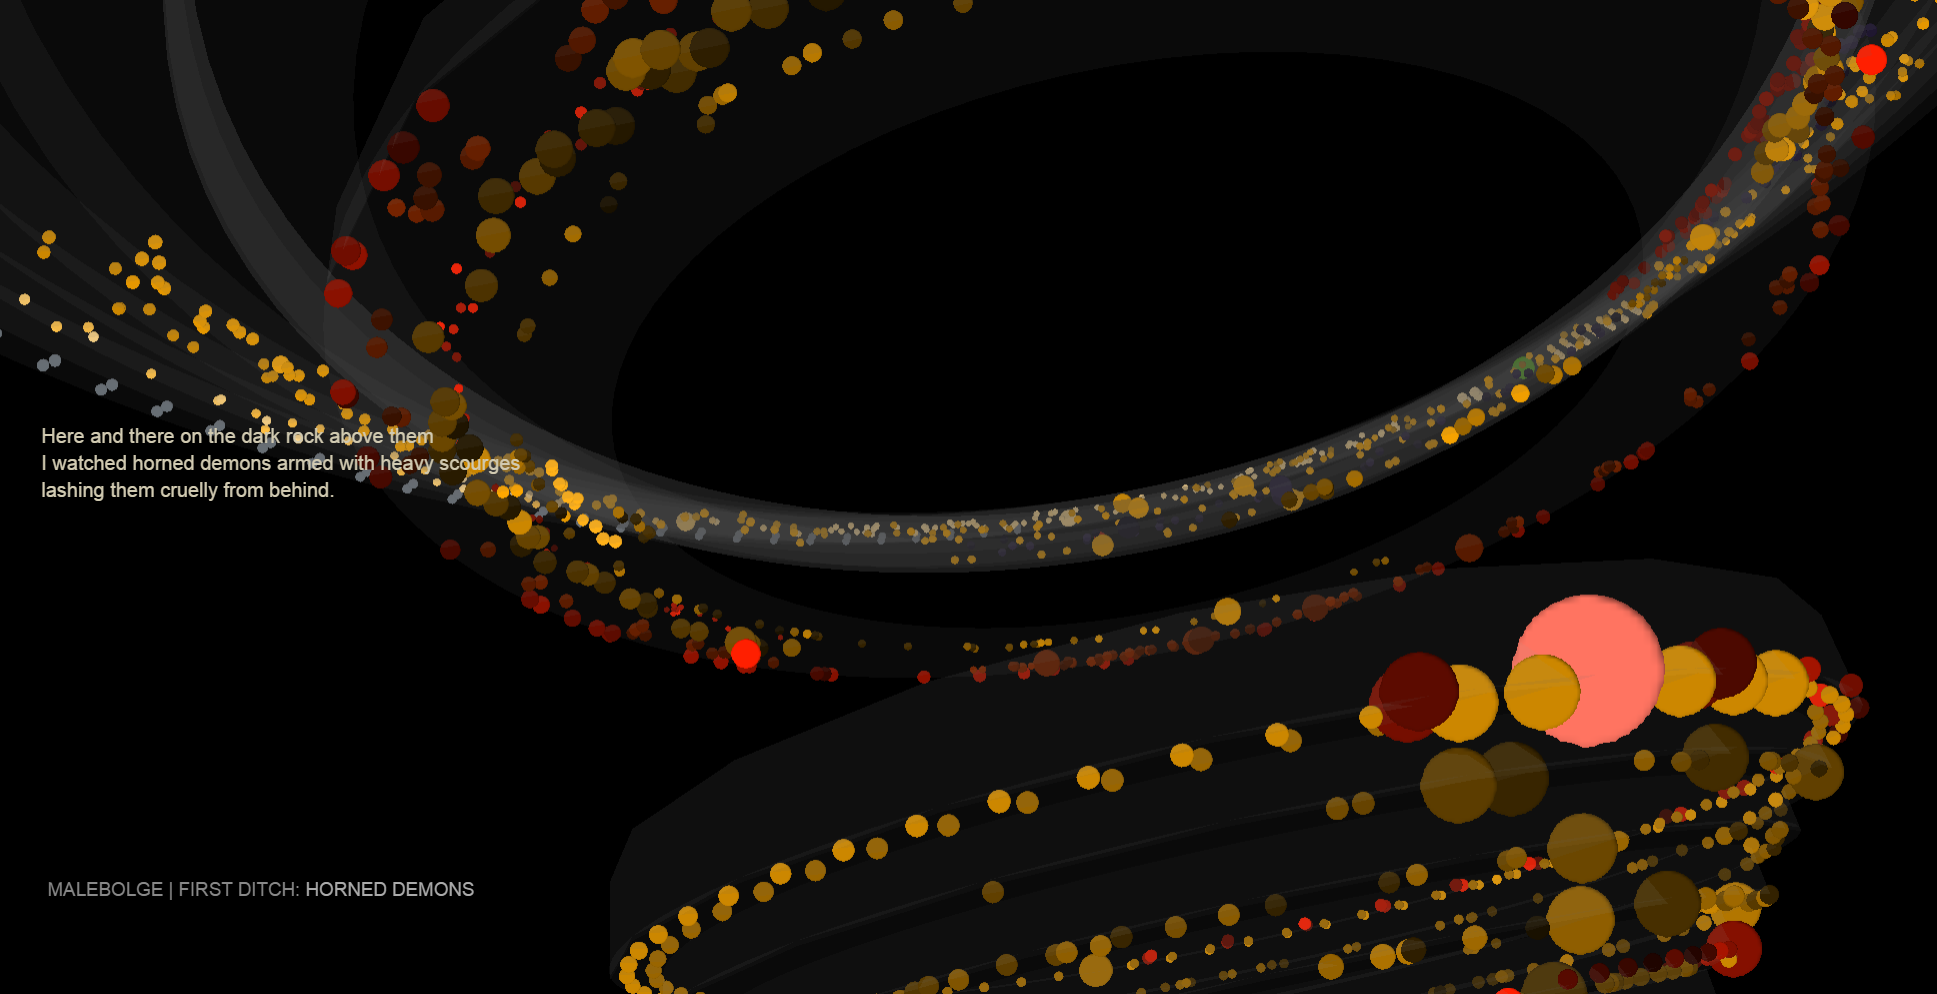
Map of Hell
One of Parson’s recent MA graduates in data visualization put dataviz right in the heart of digital humanities with this map of Dante’s Inferno. The descending circles are visualized in an interactive graphic which can be spun, zoomed and tilted. Each dot represents a character Dante encountered on his journey, coded by type. Hovering over each brings up the stanza specific to that point.

A very engaging project, and the one I went home thinking about the most. You would think this was done in Flash, but it’s entirely in Javascript and CSS, using the Threejs and jQuery libraries.
Jane Friedhoff
Office for Creative Research
O for CR has been a regular feature at Visualized. They are responsible for some unbelievably interesting scientific, as well as high-visibility projects such as creating the algorithm for displaying names at the 9/11 Memorial in New York City. This year’s presentation was “Elephant Count — Making the Elephant Atlas.” This large-scale research project included flying planes in stripes across broad swaths of Africa, to count how many elephants there are, what herds and family groupings there are, what there range is, and so on.
Kim Albrecht
The Cosmic Web
Speaking of large-scale projects, the Cosmic Web is a map of the universe. Galaxy-by-galaxy, as best we know it. You can interactively model the forces that hold galaxies together, filter them, pan, rotate and zoom.
Giorgia Lupi
accurat.it
Giorgia was the belle of the ball last year with her presentation about Dear Data, a collaborative trans-Atlantic partnership where hand-drawn postcards were mailed back and forth and, over time, developed into a set of data about how they lived their lives. This year’s presentation centered around the work of her firm, Accurat. Their marvelous visualizations published in various print media engage you in a serious look at complex ideas.