The Context for UNA-USA Programs and Activities
Public Opinion Polling Data, 1945 – 2015, on Americans’ Attitudes towards the UN and American Policies concerning the UN
By A. Edward Elmendorf, with Haoran Sun, August 2015
Introduction and Overview
In September 1998, then UNA-USA Board Chair John C. Whitehead told a press conference at the United Nations, along with UNA-USA President Alvin Adams and Policy Studies Executive Director Jeffrey Laurenti, that Americans overwhelmingly supported the UN and the job it was doing. 60 percent of the American public believed the United Nations was doing a ‘very good job,’ and 72 percent viewed it as a ‘very important’ organization, according to a survey conducted by Wirthlin Worldwide for UNA-USA. Laurenti observed that members of the United States Congress who expressed hostility towards the United Nations were not reflecting the views of their constituents.[1]
Against that background, this paper presents an overview of public opinion polling concerning Americans’ attitudes towards the United Nations and American policies concerning the United Nations, from 1945 through 2015. The overall message is that Americans have long been convinced that the UN should be a key international player.[2] As former UNA-USA president Edward Luck concluded in 1999, the UN ‘has traditionally been held in a position of esteem and respect by the bulk of the American people.’ Over the sixteen years since then, this has continued to be the case, overall, though there has been some slippage, especially during the second Bush Administration.
While the overall positive thrust remains today, Americans’ opinions of the UN have shifted somewhat over the years, from varying, qualified, and strong support, from halcyon optimism in the early years through declines when the US suffered reverses in the UN and increases when the UN supported the US. Overall and not surprisingly, opinions on UN performance in response to the challenges it has had to face have varied more markedly than on the UN overall, and have been less positive. Responses to questions varied greatly, also, by how the question was formulated. Attitudes have also varied according to the personality and skills of the UN Secretary-General, and how he has been viewed by the US Government. Boutros-Ghali’s re-election as secretary-general was effectively vetoed by the United States, but Kofi Annan was viewed positively by Americans, if not always by the United States Government. Commenting on UNA-USA opinion polling results showing improvements in attitudes towards the UN, UNA-USA president Alvin Adams attributed them to Secretary-General Kofi Annan. Adams said ‘Mr. Annan’s political skills and personable approach to Americans is probably helping improve the image of the United Nations in the United States.’ [3]
The data in this paper have almost completely been taken from Gallup Brain and University of Connecticut Roper Center data bases reviewed at the library of American University (AU), which subscribes to both Gallup and Roper Center services. The samples were American adults, generally around 1,000. The data are publicly available to researchers, including daily visitors, who use the American University library. For the purposes of preparing this paper, thousands of specific questions asked at identified times were screened on the AU Library website and relevant data were extracted. Key attitudinal questions concerning American’s opinions on the United Nations were selected from the Gallup and Roper Center data bases. These extracts in turn were used to create new data files on the responses to the same question at different times. Subsequently, these new data files were used to create the longitudinal data graphs presented in this annex. In many cases, however, long term data on the same question were not available, as the formulation of questions changed over time. Thus, the graphs show gaps and different beginning and ending periods, according to the specific issue.
UNA-USA sponsored opinion polls in 1989, 1990, 1996, and 1998, as reported by former CEO Edward C. Luck, posing questions about UN performance.[4] Other questions were also posed (see Chapter xxxx, UNA’s National Constituency – Members and Allies), but only limited results are available, some of which are reflected in the 1998 news conference at the UN reported above.
United States Public Opinion about Joining the United Nations and Sustaining Membership
In the summer of 1945, after the San Francisco conference to elaborate the United Nations Charter and just before the advent of the atomic age with the bombing of Hiroshima and the conclusion of World War II, American opinion strongly favored joining the UN and Senate ratification of the United Nations Charter. In June 1945 over 80 percent of Americans favored joining the United Nations (Graph 2), and in July nearly two-thirds approved Senate ratification of the UN Charter and only 3 percent opposed ratification (Graph 1). The efforts by the AAUN, other NGOs and political leaders to gain support for the United Nations and ratification of its Charter discussed in Chapter xxx [insert cross reference!] clearly had had a positive impact on public opinion, at least among people who knew about the UN.
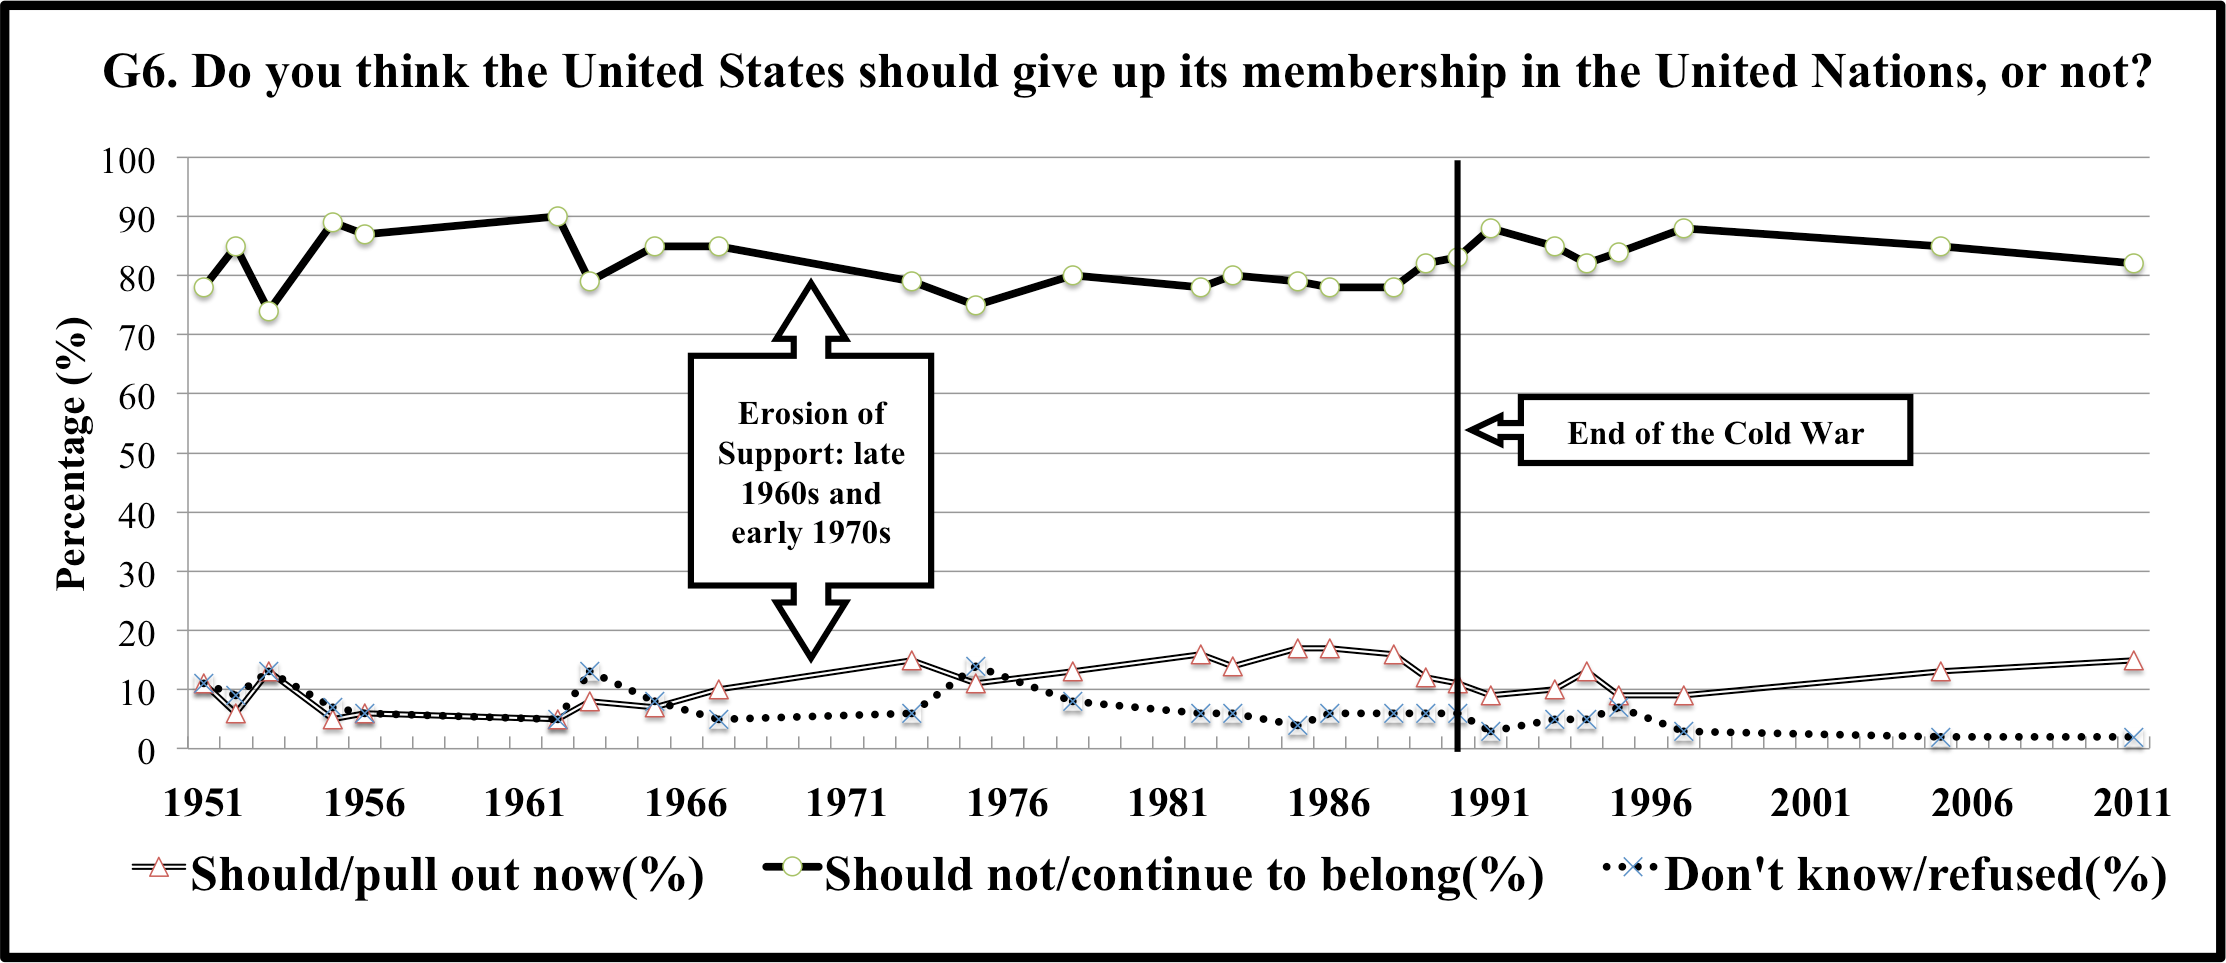
Over many decades public opinion in the US has strongly favored sustaining American membership in the United Nations. Asked (Graph 6) “Do you think the U.S. should give up its membership in the United Nations, or not?”, over nearly 70 years 70 percent or more of Americans have opposed giving up US membership in the world organization. Support has varied upwards over the years, with as many as 90 percent of Americans opposed to leaving the UN in the late 1950s and at the end of the Cold War.
Overall Opinions of the United Nations
Overall opinion polling data on Americans’ attitudes towards the United Nations are not available with consistent time-series information from 1945 onwards. Unfortunately, the question was posed in too many different ways to permit compilation of long term trends. Available data are summarized here, with results as indicated below.
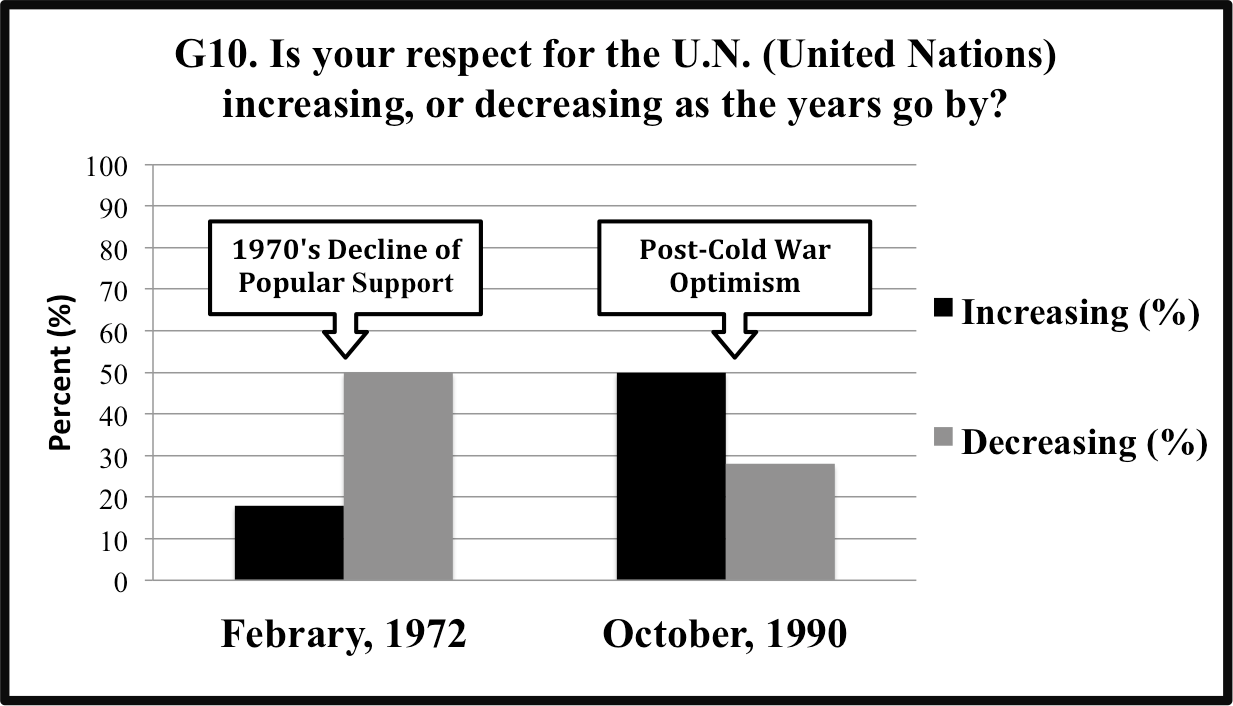
While positive overall, Americans’ views of the UN have varied greatly over the 70 years of the UN’s existence. In the 1970s, with the decline of popular support for the UN following UN decisions unfavorable to US policies, a 1972 poll showed respect for the United Nations decreasing as the years went by (Graph 10). But, in the halcyon optimism of the Post Cold War period, a 1990 poll showed respect for the United Nations to be increasing (Graph 10). The support among Americans for increasing US participation in the UN after the end of the Cold War is shown (Graph 13) by a nearly 20 percent rise in support for increased US participation in the UN, from 1989 to 1991. In 1994, nearly 90 percent of Americans (Graph 14) thought it extremely important or somewhat important that the US cooperate with other countries by working through the UN. In 2006 and 2007 polling by the Chicago Council on Global Affairs, 60 percent of Americans agreed that the US should be ‘more willing to make decisions with the UN,’ even if it means agreeing to a policy that is not their first choice.[5]
Graph 3 shows favorable and unfavorable opinions by Americans of the United Nations from 1985 through 2014. Very favorable, mostly favorable, and somewhat favorable opinions consistently summed to above 50 percent, with highs as great as 70 percent. It is striking, nonetheless, that the overall trend since roughly the year 2000 has been towards somewhat less favorable ratings, with some improvement since 2009. A few contrasts: Among a wide range of people and institutions whose ‘favorability’ to Americans was assessed and ranked by pollsters in 2014, the UN had the most positive ratings, at 59 percent, yet the US Congress fell well down the list, at only 29 percent favorable.[6] Looking at other countries and public opinion there on the UN puts US opinion in global context: Compared to 52 percent positive American opinion in a BBC survey in 2005, at a time of considerable criticism of the UN by the Bush Administration, 65 percent of Canadians viewed the UN positively, 62 percent of Mexicans, 80 percent of Germans, 77 percent of Finns, 63 percent of Iranians, 75 percent of Nigerians, and 80 percent of Indonesians, but only 38 percent in Russia, 44 percent in India and 36 percent in Sri Lanka.[7] Surveys in Japan in 2006 showed 48 percent positive, 35 percent negative.[8]
Strengthening the United Nations
In the early years of the United Nations, American opinion on world affairs and the United Nations was so positive that the question of strengthening it to make it a world government was one that could not be excluded. In 1955 (Graph 5a) as many as 40 percent of Americans responded positively to the question whether the UN should or should not be strengthened to make it a world government, with power to control the armed forces of all nations, including the United States. Thus, well into the Cold War and the debate on the isolationist Bricker Amendment (Chapter ….) 40 percent of Americans supported world government through the UN. Clark Eichelberger and the AAUN, however, were much more cautious, and found themselves in disagreement with the World Federalists in advocating internationalist policies and measures that would increase the effectiveness and autonomy of the UN without reference to world government (Chapter ….).
Actions to strengthen the UN were surveyed by the Chicago Council on Global Affairs in 2005 and 2006, with striking results showing Americans’ wish for increasing UN authority: 75 percent of Americans favored giving the UN the authority to go into countries in order to investigate human rights abuses (as is now done, to some extent, by UN special rapporteurs under the authority of the UN Human Rights Council); 75 percent favored creating an international marshals service that could arrest leaders responsible for genocide (in contrast to the recent failure of the South African authorities to arrest the President of Sudan, then in the country, despite a warrant for his arrest by the International Criminal Court); 72 percent favored having a standing UN peacekeeping force selected, trained and commanded by the United Nations; 60 percent favored giving the UN power to regulate the international arms trade; and 45 percent favored giving the UN power to fund its activities by imposing a small tax on such things as the international sale of arms or oil.[9]
United States Cooperation with the United Nations
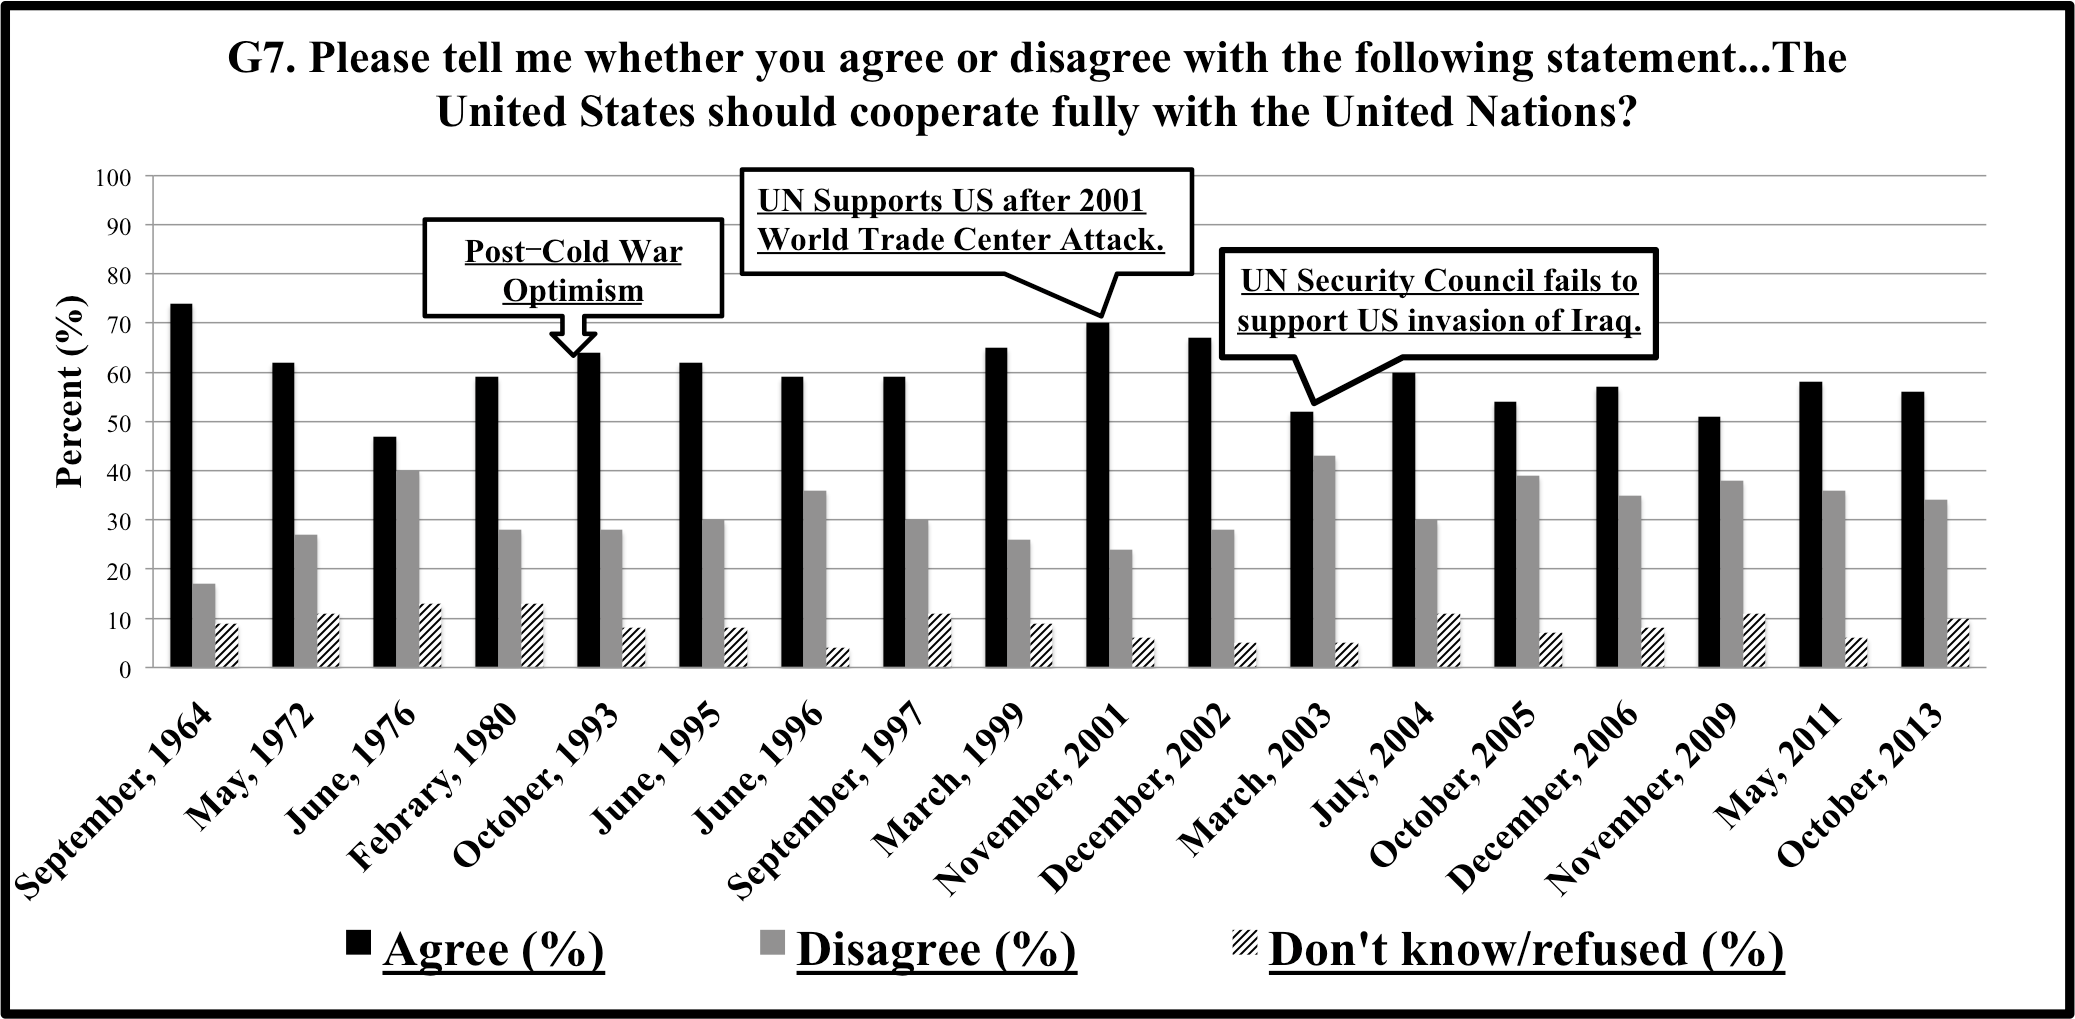
US cooperation with the UN has been a subject in public opinion polling in many years. Asked whether they agree or disagree with the statement that the United States should cooperate fully with the United Nations, more than 50 percent of Americans have nearly always agreed (Graph 7). In 2001, in the wake of the World Trade Center attack, as many as 70 percent of Americans agreed. Of the years in which the question was polled, only in 1976 and 2003 did the share of Americans disagreeing with the statement begin to approach those agreeing with it, though a substantial gap remained. It is likely that in 1976 this reflected American dissatisfaction with UN actions on China, Zionism and racism, and the New International Economic Order or NIEO (Chapter ….) and in 2003 the failure of the UN Security Council to support the US invasion of Iraq and the public statements of the George W. Bush administration on the ‘irrelevance’ of the UN if it failed to endorse the planned US invasion. World Public Opinion reports that even in 2005 nearly two-thirds of Americans thought ‘the UN plays a necessary role in the world.’ A German Marshal Fund poll in 2005 showed that 56 percent of Americans agreed that the UN could ‘manage many of the world’s most pressing problems better than any single country.’[10]
Pollsters have asked Americans for many years about the importance that they attach to strengthening the United Nations as an American foreign policy goal. At least since the end of the Cold War, over 70 percent of Americans, and many times as many as 80 percent, have thought that strengthening the UN should be a very important, important or somewhat important U.S. foreign policy goal (Graph 8). In the few years in which the question was posed prior to the end of the Cold War, responses were still consistently higher than 70 percent.
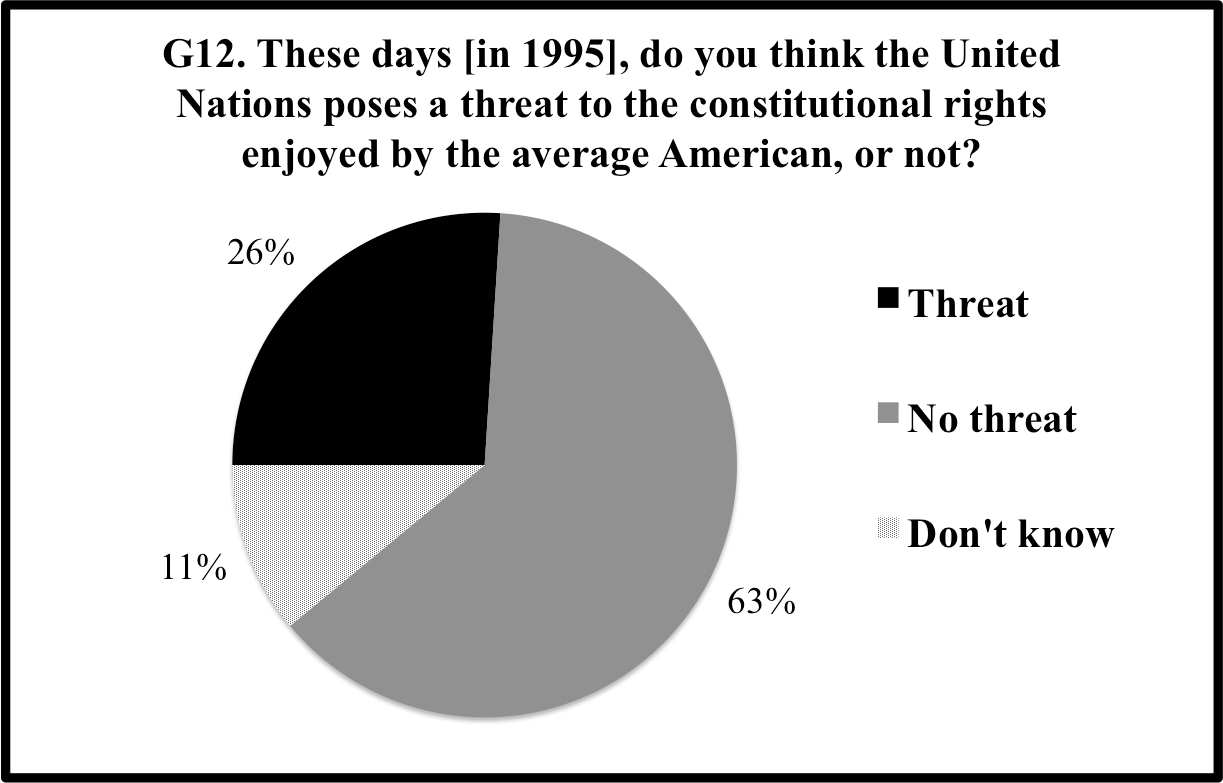
Changing attitudes in the United States on the United Nations and American autonomy, from 1955, 1995, and 2004 are reflected in Graphs 5a, 5b, 5c, and 5d. In the early years of the UN, one question of concern in opinion polling was whether the UN should be strengthened with power to control the armed forces of all nations, including the US. Only a slight majority disagreed with this proposition in 1955 (Graph 5a). Reflecting a radical reversal in public attitudes, a key question polled in 1995 was whether the UN has too much, the right amount, or not enough power in the United States. A significant 20 percent minority thought the UN had too much power in the US, but nearly two-fifths of Americans – twice as many as thought the UN had too much power – thought the UN did not have enough power in the US (Graph 5b). This may reflect the positive and negative stresses of globalization in the United States, with decreases in relative American power and a felt need for greater global order. Again reflecting underlying changes in American moods, pollsters asked in 1995 whether Americans thought the United Nations poses a threat to the constitutional rights enjoyed by the average American. 26 percent saw a threat in the United Nations, and 63 percent saw no threat (Graph 12). In 2004, however, the question posed reflected new moods: Do you believe that the policies of the United Nations are pro-American or anti-American. Nearly forty percent of Americans (Graph 5c) then considered UN policies anti-American. In 2013 and 2014, however, nearly two-third of Americans thought the UN supportive of American goals and objectives around the world (Graph 5d).
Americans’ sometimes ambivalent attitudes towards the UN are revealed in the controversy about withholding dues payable to the United Nations. These payments are a treaty obligation under the UN Charter, and in 1989, when major discussions were under way within the UN, in the US Congress, and around the US on the issue (Chapter …..) In 1989, 60 percent (Graph 11) of Americans thought the US should always pay rather than hold back dues to press other members to agree to changes we believe are needed. Not long thereafter, a majority of Americans rejected specific conditions being attached to payment of dues, even on politically popular issues such as cutting the UN bureaucracy or lowering United States dues.[11]
The profound effect of the United States 2003 invasion of Iraq on Americans’ perceptions of the United Nations is shown in Graph 15. Asked in 2004 whether the United Nations emerged over the past three years as a ‘winner’ or ‘loser,’ from this period, over 50 percent of Americans polled viewed the United Nations as a ‘big loser’ or ‘loser.’ Subsequently, attitudes changed.
United Nations Performance
Questions on Americans’ assessment of UN performance have been asked by pollsters from the 1950s to the present (Graph 9). Asked whether, in general, Americans thought the United Nations was doing a good job or a poor job in trying to solve the problems it has had to face, their opinions have varied greatly over the decades. Globally, there appears to have been a fairly steady decline in good job ratings from 1955 through 1975, improvement around the end of the Cold War, and steady but remarkable declines in good job ratings reflecting erosion in positive assessments from 2002 through 2009; since 2009 the data show a little recovery. Caution is needed in interpreting these data, however, since the formulation of the question incorrectly assumes that the United Nations has the authority and capacity to solve the problems it has had to face, whether of nuclear weapons in North Korea and Iran or of conflict in the Middle East.
Bibliography
Note: Except as indicated in the text and footnotes, all data on which this paper is based were accessed on the website of the American University Library.
America’s Role In The World Poll: (year 1996) telephone interviews, data provided by The Roper Center for Public Opinion Research, University of Connecticut.
Americans On The War On Terrorism Survey: (year 2001) telephone interviews, data provided by The Roper Center for Public Opinion Research, University of Connecticut.
Americans Talk Security: (year 1988) telephone interviews, data provided by The Roper Center for Public Opinion Research, University of Connecticut.
Campaign Financing And Other National Issues: (year 1980) personal interviews, data provided by The Roper Center for Public Opinion Research, University of Connecticut.
CBS News/New York Times Poll: (various years: 1991 and 1994) telephone interviews, data provided by The Roper Center for Public Opinion Research, University of Connecticut.
Chicago Council Survey: (year 2012) online interviews, data provided by The Roper Center for Public Opinion Research, University of Connecticut.
CNN/ORC (Open Researcher and Contributor) International Poll: (year 2011) telephone interviews, data provided by The Roper Center for Public Opinion Research, University of Connecticut.
Fox News/Opinion Dynamics: (year 2004) telephone interviews, data provided by The Roper Center for Public Opinion Research, University of Connecticut.
Gallup Poll: (various years: 1945, 1951, 1953, 1954, 1955, 1962, 1963, 1964, 1970, 1971, 1972, 1975, 1976, 1978, 1980, 1982, 1983, 1985, 1986, 1990, 1993, 1994, 1995, 1996, 1997, 1998, 2000, 2001, 2002, 2003, 2004, 2005, 2006, 2007, 2008, 2009, 2010, 2011, 2012, 2013, 2014, and 2015) personal interviews, data provided by The Roper Center for Public Opinion Research, University of Connecticut.
General Social Survey: (various years: 1952, 1953, 1955, 1956, 1965, 1973, 1978, 1982, 1983, 1985, 1986, 1988, 1989, 1990, 1991, 1993, 1994 and 2002) personal interviews, data provided by The Roper Center for Public Opinion Research, University of Connecticut.
Global Views Survey: (various years: 2004, 2006, and 2010) online interviews, data provided by The Roper Center for Public Opinion Research, University of Connecticut.
Greenberg Quinlan Rosner Research: (year 2004) telephone interviews, data provided by The Roper Center for Public Opinion Research, University of Connecticut.
Harris/CCFR Survey of American Public Opinion and U.S. Foreign Policy: (year 1974) personal interviews, data provided by The Roper Center for Public Opinion Research, University of Connecticut.
International Policy Opinion Survey: (year 1993) telephone interviews, data provided by The Roper Center for Public Opinion Research, University of Connecticut.
Los Angeles Times: (various years: 1985, 1995 and 2002) telephone interviews, data provided by The Roper Center for Public Opinion Research, University of Connecticut.
Office of Public Opinion Research: (years 1945) personal interviews, data provided by The Roper Center for Public Opinion Research, University of Connecticut.
People, The Press & Politics Poll: (various years: 1993, 1994, and 1995) telephone interviews, data provided by The Roper Center for Public Opinion Research, University of Connecticut.
Pew Research Center: (various years: 1996, 1997, 1999, 2001, 2002, 2004, 2005, 2006, 2007, 2008, 2009, 2011, 2012, and 2013) telephone interviews, data provided by The Roper Center for Public Opinion Research, University of Connecticut.
Princeton Survey Research Associates: (year 2003) telephone interviews, data provided by The Roper Center for Public Opinion Research, University of Connecticut.
Roper Survey for the UN Association of the USA: (various years: 1989 and 1998) personal interviews, data provided by The Roper Center for Public Opinion Research, University of Connecticut.
Time/CNN/ Harris Interactive Poll: (year 2003) telephone interviews, data provided by The Roper Center for Public Opinion Research, University of Connecticut.
Washington Post Poll: (year 1991) telephone interviews, data provided by The Roper Center for Public Opinion Research, University of Connecticut.
Worldviews Survey: (year 2002) telephone and in-person[12] interviews, data provided by The Roper Center for Public Opinion Research, University of Connecticut.
Graphs and Tables
Graph 1

Source: Gallup data
Table 1
| Month/Year | Yes (%) | No (%) | Haven’t heard or read about the charter/ no opinion (%) | Pollster/Notes |
| July, 1945 | 64 | 3 | 33 | Gallup/National adult sample of 1500 |
Graph 2
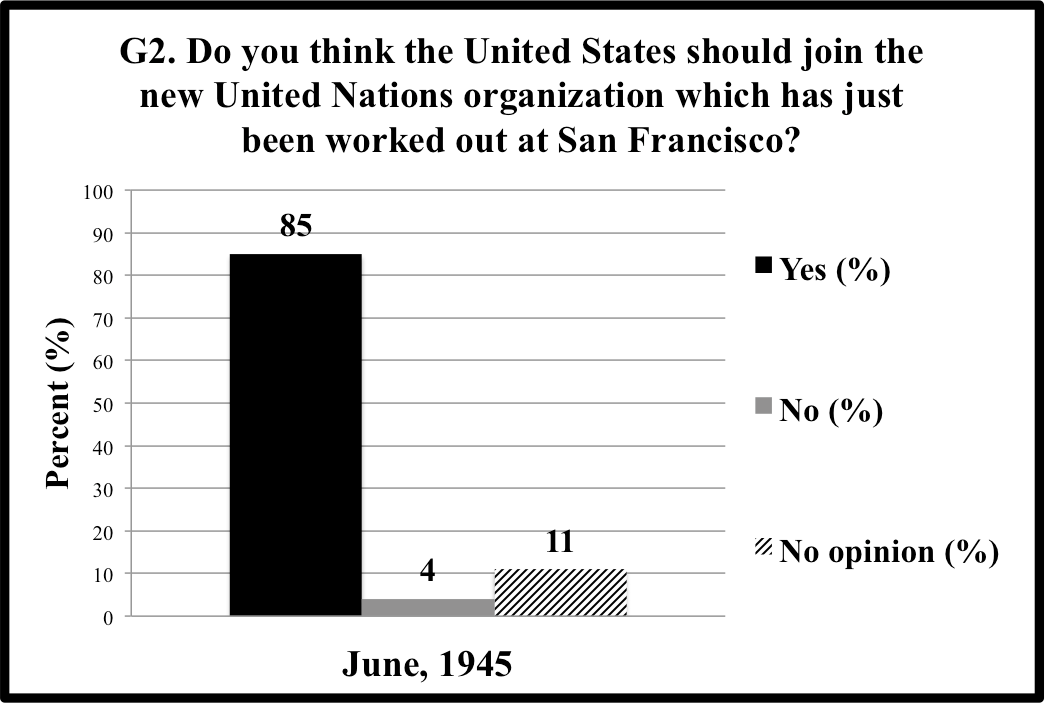
Source: Office of Public Opinion Research data
Table 2
| Year | Yes(%) | No(%) | No opinion (%) | Pollster/Notes |
| June, 1945 | 85 | 4 | 11 | OPOR/National adult sample of 1203 |
Graph 3[13]: Favorable and Unfavorable Opinions of The United Nations, Selected Years, 1985-2013
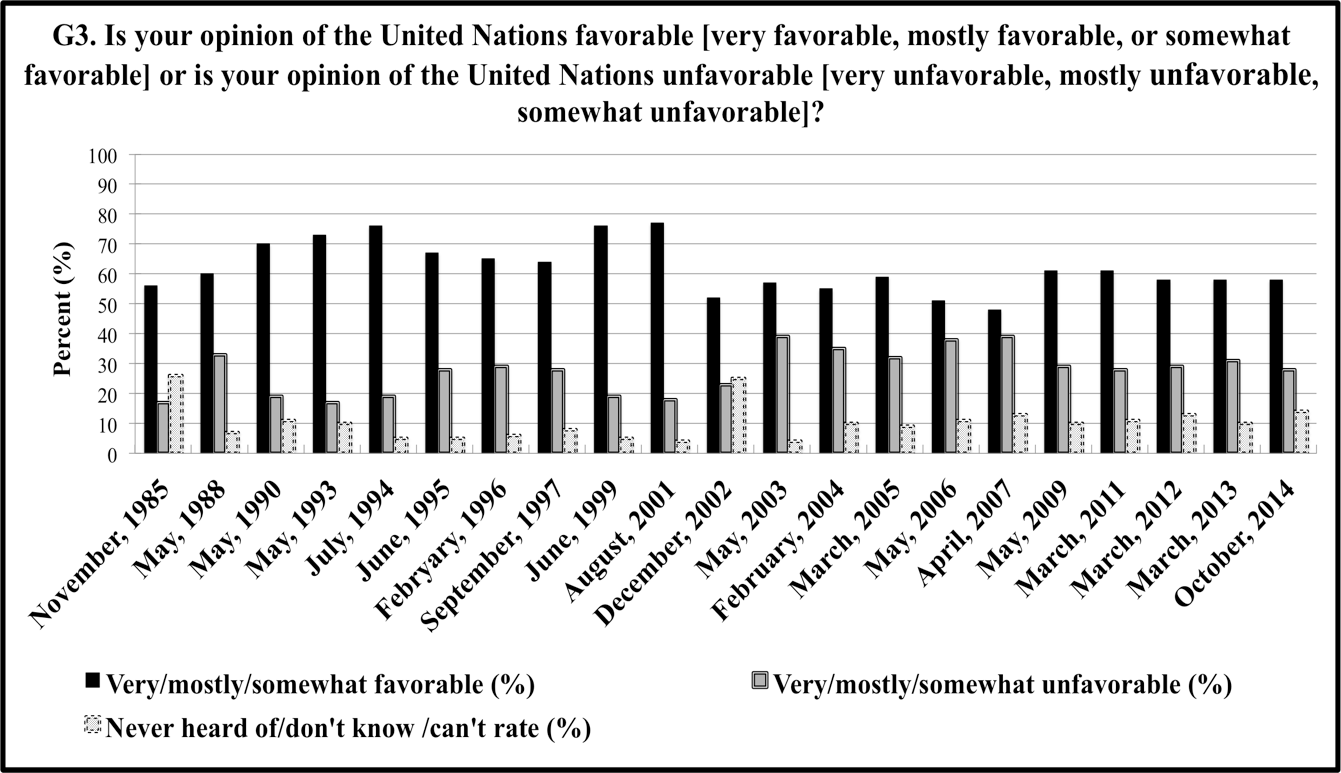
Source: Los Angeles Times, Americans Talk Security, People, The Press & Politics Poll, Time/CNN/ HARRIS Interactive Poll, and Pew Research Center data.
Table 3[14]
| Month/Year | Very/ mostly/ somewhat favorable (%) | Very/ mostly/ somewhat unfavorable (%) | Never heard of/ don’t know/ can’t rate (%) | Pollster/Notes |
| 10/1985s | 56 | 17 | 26 | Los Angeles Time/National adult sample of 2041 |
| 1986 | ||||
| 1987 | ||||
| 05/1988F | 60 | 33 | 7 | Americans Talk Security/National adult sample of 1003 |
| 1989 | ||||
| 05/1990M | 70 | 19 | 11 | People, The Press & Politics Poll/National adult sample of 3004 |
| 1991 | ||||
| 1992 | ||||
| 05/1993M | 73 | 17 | 10 | People, The Press & Politics Poll/National adult sample of 1507 |
| 07/1994M | 76 | 19 | 5 | People, The Press & Politics Poll/National adult sample of 3800 |
| 06/1995M | 67 | 28 | 5 | People & The Press–Foreign Policy Poll/National adult sample of 1500 |
| 02/1996M | 65 | 29 | 6 | Pew News Interest Index Poll/National adult sample of 1500 |
| 09/1997M | 64 | 28 | 8 | Pew Research Center for the People & the Press America’s Place In The World Survey /National adult sample of 2000 |
| 1998 | ||||
| 06/1999M | 76 | 19 | 5 | Pew News Interest Index Poll/National adult sample of 3973 |
| 2000 | ||||
| 08/2001M | 77 | 18 | 4 | Pew Research Center for the People & the Press/CFR America’s Place in the World III Poll/National adult sample of 1000 |
| 12/2002F | 52 | 23 | 25 | Los Angeles Time/National adult sample of 1305 |
| 05/2003s | 57 | 39 | 4 | Time/CNN/Harris Interactive Poll/National adult sample of 1012 |
| 02/2004s | 55 | 35 | 10 | Pew Global Attitudes Project Poll/National adult sample of 1000 |
| 03/2005M | 59 | 32 | 9 | Pew Research Center for the People & the Press Political Typology Callback Poll/National adult sample of 1090 |
| 05/2006s | 51 | 38 | 11 | Pew Global Attitudes Project Poll/National adult sample of 1001 |
| 04/2007s | 48 | 39 | 13 | Pew Global Attitudes Project Poll/National adult sample of 2026 |
| 2008 | ||||
| 05/2009s | 61 | 29 | 10 | Pew Global Attitudes Project Poll/National adult sample of 1000 |
| 2010 | ||||
| 03/2011s | 61 | 28 | 11 | Pew Global Attitudes Project Poll/National adult sample of 1001 |
| 03/2012s | 58 | 29 | 13 | Pew Global Attitudes Project Poll/National adult sample of 1001 |
| 03/2013s | 58 | 31 | 10 | Pew Global Attitudes Project Poll/National adult sample of 1002 |
| 10/2014s | 58 | 28 | 14 | Public Opinion Strategies & Hart Research/N=800 Registered Voters (536 Landline/264 Cell) |
Graph 5a & 5b: Changing Attitudes on The United Nations and United States Autonomy

Source: Gallup and FOX News/Opinion Dynamics data
Table 5a & 5b
| Q5a. Do you think the United Nations should or should not be strengthened to make it a world government, with power to control the armed forces of all nations, including the United States? | ||||
| Year | Yes/should (%) | No/should not (%) | Undecided/no opinion (%) | Pollster/notes |
| 1955 | 40 | 42 | 18 | Gallup/National adult sample of 1500 |
| Q5b. (As I read off each of the following, please tell me whether you think it has too much power in the United States today, about the right amount of power, or not enough power.)… The United Nations | |||||
| Year | Too much (%) | Right amount (%) | Not enough (%) | No opinion (%) | Pollster/notes |
| 1995 | 21 | 35 | 39 | 5 | Gallup/National adult sample of 1066 |
Graph 5c & 5d: Changing Attitudes on The United Nations and United States Autonomy
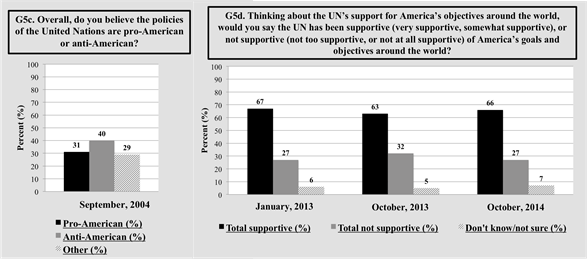
Source: FOX News/Opinion Dynamics and Public Opinion Strategies and Hart Research data
Table 5c & 5d
| Q5c. Overall, do you believe the policies of the United Nations are pro-American or anti-American? | ||||
| Year | Pro-American (%) | Anti-American (%) | Other (%) | Pollster/notes |
| 2004 | 31 | 40 | 29 | FOX News/Opinion Dynamics Poll/National adult sample of 1000 |
| Q5d. Thinking about the UN’s support for America’s objectives around the world, would you say the UN has been…(ROTATE TOP TO BOTTOM, BOTTOM TO TOP)…very supportive, somewhat supportive, not too supportive, or not at all supportive of America’s goals and objectives around the world? | ||||
| Month/Year | Total supportive (%) | Total not supportive (%) | Don’t know/not sure (%) | Pollster/notes |
| January, 2013 | 67 | 27 | 6 | Public Opinion Strategies & Hart Research |
| October, 2013 | 63 | 32 | 5 | Public Opinion Strategies & Hart Research |
| October, 2014 | 66 | 27 | 7 | Public Opinion Strategies & Hart Research |
Graph 6: Opinions on United States Membership in The United Nations, Selected Years, 1951-2011
Source: Gallup, National Opinion Research Center, General Social Survey, and CNN/ORC International Poll data
Table 6
| Year | Should pull out now (%) | Should not continue to belong (%) | Don’t know/ refused (%) | Pollster/notes |
| 1951 | 11 | 78 | 11 | Gallup/National adult sample of 2019 |
| 1952 | 6 | 85 | 9 | General Social Survey /National adult sample of 1265 |
| 1953 | 13 | 74 | 13 | General Social Survey /National adult sample of 1232 |
| 1954 | ||||
| 1955 | 5 | 89 | 7 | General Social Survey /National adult sample of 1262 |
| 1956 | 6 | 87 | 6 | General Social Survey /National adult sample of 1287 |
| 1957 | ||||
| 1958 | ||||
| 1959 | ||||
| 1960 | ||||
| 1961 | ||||
| 1962 | 5 | 90 | 5 | Gallup/National adult sample of 1616 |
| 1963 | 8 | 79 | 13 | Gallup |
| 1964 | ||||
| 1965 | 7 | 85 | 8 | General Social Survey /National adult sample of 1469 |
| 1966 | ||||
| 1967 | 10 | 85 | 5 | Gallup/National adult sample of 1518 |
| 1968 | ||||
| 1969 | ||||
| 1970 | ||||
| 1971 | ||||
| 1972 | ||||
| 1973 | 15 | 79 | 6 | General Social Survey/National adult sample of 1504 |
| 1974 | ||||
| 1975 | 11 | 75 | 14 | Gallup/National adult sample of 1560 |
| 1976 | ||||
| 1977 | ||||
| 1978 | 13 | 80 | 8 | General Social Survey /National adult sample of 1532 |
| 1979 | ||||
| 1980 | ||||
| 1981 | ||||
| 1982 | 16 | 78 | 6 | General Social Survey /National adult sample of 1506 |
| 1983 | 14 | 80 | 6 | General Social Survey /National adult sample of 1599 |
| 1984 | ||||
| 1985 | 17 | 79 | 4 | General Social Survey /National adult sample of 1534 |
| 1986 | 17 | 78 | 6 | General Social Survey /National adult sample of 1470 |
| 1987 | ||||
| 1988 | 16 | 78 | 6 | General Social Survey /National adult sample of 1481 |
| 1989 | 12 | 82 | 6 | General Social Survey /National adult sample of 1537 |
| 1990 | 11 | 83 | 6 | General Social Survey /National adult sample of 1372 |
| 1991 | 9 | 88 | 3 | General Social Survey /National adult sample of 1517 |
| 1992 | ||||
| 1993 | 10 | 85 | 5 | General Social Survey /National adult sample of 1606 |
| 1994 | 13 | 82 | 5 | General Social Survey /National adult sample of 2992 |
| 1995 | 9 | 84 | 7 | Gallup/National adult sample of 1229 |
| 1996 | ||||
| 1997 | 9 | 88 | 3 | Gallup/National adult sample of 1019 |
| 1998 | ||||
| 1999 | ||||
| 2000 | ||||
| 2001 | ||||
| 2002 | ||||
| 2003 | ||||
| 2004 | ||||
| 2005 | 13 | 85 | 2 | Gallup/National adult sample of 1008 |
| 2006 | ||||
| 2007 | ||||
| 2008 | ||||
| 2009 | ||||
| 2010 | ||||
| 2011 | 15 | 82 | 2 | CNN/ORC International Poll/National adult sample of 1038 |
Graph 7: Opinions on Whether The United States Should Cooperate Fully With The United Nations, Selected Years, 1964-2013
Source: America’s Role In The World Poll, Campaign Financing And Other National Issues, Gallup, International Policy Opinion Survey, People & The Press–Foreign Policy/United Nations Poll, and Pew Research Center data
Table 7
| Month/Year | Agree (%) | Disagree (%) | Don’t know/refused (%) | Pollster/Notes |
| September, 1964 | 74 | 17 | 9 | Gallup/National adult sample of 1611 |
| May, 1972 | 62 | 27 | 11 | Gallup/National adult sample of 613 |
| June, 1976 | 47 | 40 | 13 | Gallup/National adult sample of 1071 |
| February, 1980 | 59 | 28 | 13 | Campaign Financing And Other National Issues/National adult sample of 1611 |
| October, 1993 | 64 | 28 | 8 | International Policy Opinion Survey/National adult sample of 1200 |
| June, 1995 | 62 | 30 | 8 | People & The Press–Foreign Policy/United Nations Poll/National adult sample of 1007 |
| June, 1996 | 59 | 36 | 4 | America’s Role In The World Poll/National adult sample of 1227 |
| September, 1997 | 59 | 30 | 11 | Pew Research Center for the People & the Press U.S. Foreign Policy/Trust Survey/National adult sample of 1015 |
| March, 1999 | 65 | 26 | 9 | Pew Research Center for the People & the Press US Foreign Policy Survey/National adult sample of 1008 |
| November, 2001 | 70 | 24 | 6 | Americans On The War On Terrorism Survey/National adult sample of 602 |
| December, 2002 | 67 | 28 | 5 | Pew News Interest Index Poll/National adult sample of 1205 |
| March, 2003 | 52 | 43 | 5 | Princeton Survey Research Associates/Newsweek Poll/National adult sample of 1004 |
| July, 2004 | 60 | 30 | 11 | Pew Research Center for the People & the Press/CFR Foreign Policy And Party Images Poll/National adult sample of 1507 |
| October, 2005 | 54 | 39 | 7 | Pew News Interest Index Poll/National adult sample of 1500 |
| December, 2006 | 57 | 35 | 8 | Pew News Interest Index Poll/National adult sample of 1502 |
| November, 2009 | 51 | 38 | 11 | Pew Research Center for the People & the Press/Pew Forum on Religion & Public Life Survey/National adult sample of 1003 |
| May, 2011 | 58 | 36 | 6 | Pew Research Center for the People & the Press Poll/National adult sample of 1000 |
| October, 2013 | 56 | 34 | 10 | Pew Research Center for the People & the Press Poll/National adult sample of 1002 |
Graph 8: United Nations Strengthening as Import United States Foreign Policy Goal, Selected Years, 1974-2013

Source: Chicago Council Survey, Global Views Survey, Gallup, Harris/CCFR Survey of American Public Opinion and U.S. Foreign Policy, International Policy Opinion Survey, People & The Press–Foreign Policy Poll, Pew Research Center, and Worldviews Survey data
Table 8
| Year | Very/ somewhat important (%) | Not important/ not at all important (%) | Not sure/ don’t know (%) | Pollster/Notes |
| 1974 | 78 | 14 | 8 | Harris/CCFR Survey of American Public Opinion and U.S. Foreign Policy 1974/National adult sample of 1513 |
| 1975 | ||||
| 1976 | ||||
| 1977 | ||||
| 1978 | 79 | 13 | 8 | Gallup/National adult sample of 1546 |
| 1979 | ||||
| 1980 | ||||
| 1981 | ||||
| 1982 | 73 | 28 | Gallup/National adult sample of 341 | |
| 1983 | ||||
| 1984 | ||||
| 1985 | ||||
| 1986 | 79 | 16 | 5 | Gallup/National adult sample of 1585 |
| 1987 | ||||
| 1988 | ||||
| 1989 | ||||
| 1990 | ||||
| 1991 | ||||
| 1992 | ||||
| 1993 | 87 | 11 | 2 | International Policy Opinion Survey/National adult sample of 2000 |
| 1994 | 84 | 12 | 4 | Gallup/National adult sample of 1492 |
| 1995 | 81 | 17 | 2 | People & The Press–Foreign Policy Poll/National adult sample of 1500 |
| 1996 | ||||
| 1997 | ||||
| 1998 | 84 | 11 | 5 | Gallup/National adult sample of 1507 |
| 1999 | ||||
| 2000 | ||||
| 2001 | 92 | 7 | 1 | Pew Research Center for the People & the Press/CFR America’s Place In The World Callback Survey/National adult sample of 1281 |
| 2002 | 85 | 13 | 2 | Worldviews 2002 Survey/National adult sample of 3262 |
| 2003 | ||||
| 2004 | 81 | 17 | 2 | Global Views 2004: American Public Opinion and US Foreign Policy Survey/National adult sample of 2009 |
| 2005 | 83 | 14 | 3 | Pew Research Center for the People & the Press/CFR America’s Place In The World Survey/National adult sample of 2006 |
| 2006 | 79 | 19 | 2 | Global Views 2006 Survey/National adult sample of 1227 |
| 2007 | ||||
| 2008 | 78 | 19 | 3 | Pew Research Center for the People & the Press Political/Foreign Policy Poll/National adult sample of 2982 |
| 2009 | 81 | 17 | 2 | Pew Research Center for the People & the Press/Council on Foreign Relations America’s Place in the World Survey/National adult sample of 2000 |
| 2010 | 79 | 21 | 1 | Global Views 2010 Survey/National adult sample of 2717 |
| 2011 | ||||
| 2012 | 79 | 20 | 1 | Chicago Council Survey 2012/National adult sample of 1877 |
| 2013 | 79 | 18 | 2 | Pew Research Center for the People & the Press/Council on Foreign Relations America’s Place in the World Survey/National adult sample of 2003 |
Graph 10: Decreasing and Increasing Respect for The United Nations, 1972 and 1990
Source: Gallup data
Table 10
| Month/Year | Increasing (%) | Decreasing (%) | Pollster/notes |
| February, 1972 | 18 | 50 | GALLUP/National adult sample of 1502 |
| October, 1990 | 50 | 28 | GALLUP/National adult sample of 1002 |
Graph 12: United Nations as Threat to Americans’ Constitutional Rights?
Source: Los Angeles Times data
Table 12
| Year | Threat (%) | No threat (%) | Don’t know (%) | Pollster/notes |
| 1995 | 26% | 63% | 11% | Los Angeles Times/National adult sample of 1426 |
Graph 13: Post-Cold War Rise in Support, From 1989 to 1991
G13. Do you think the United States should increase or decrease its participation in the United Nations?
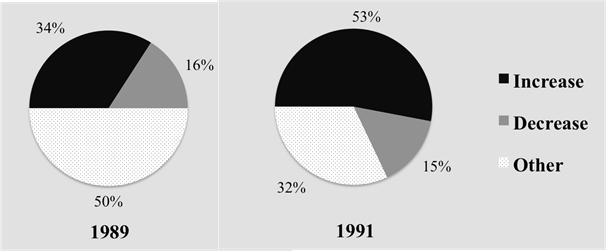
Source: Roper Center for the UNA-NCA (1989) and ICR Survey conducted for Washington Post, data provided by Roper Center (1991)
Table 13
| Year | Increase | Decrease | Other | Pollster/notes |
| 1989 | 34% | 16% | 50% | Roper Survey/National adult sample of 1978 |
| 1991 | 53% | 15% | 32% | Washington Post Poll/National adult sample of 1015 |
Graph 14: Post-Cold War Rise in Support, 1994
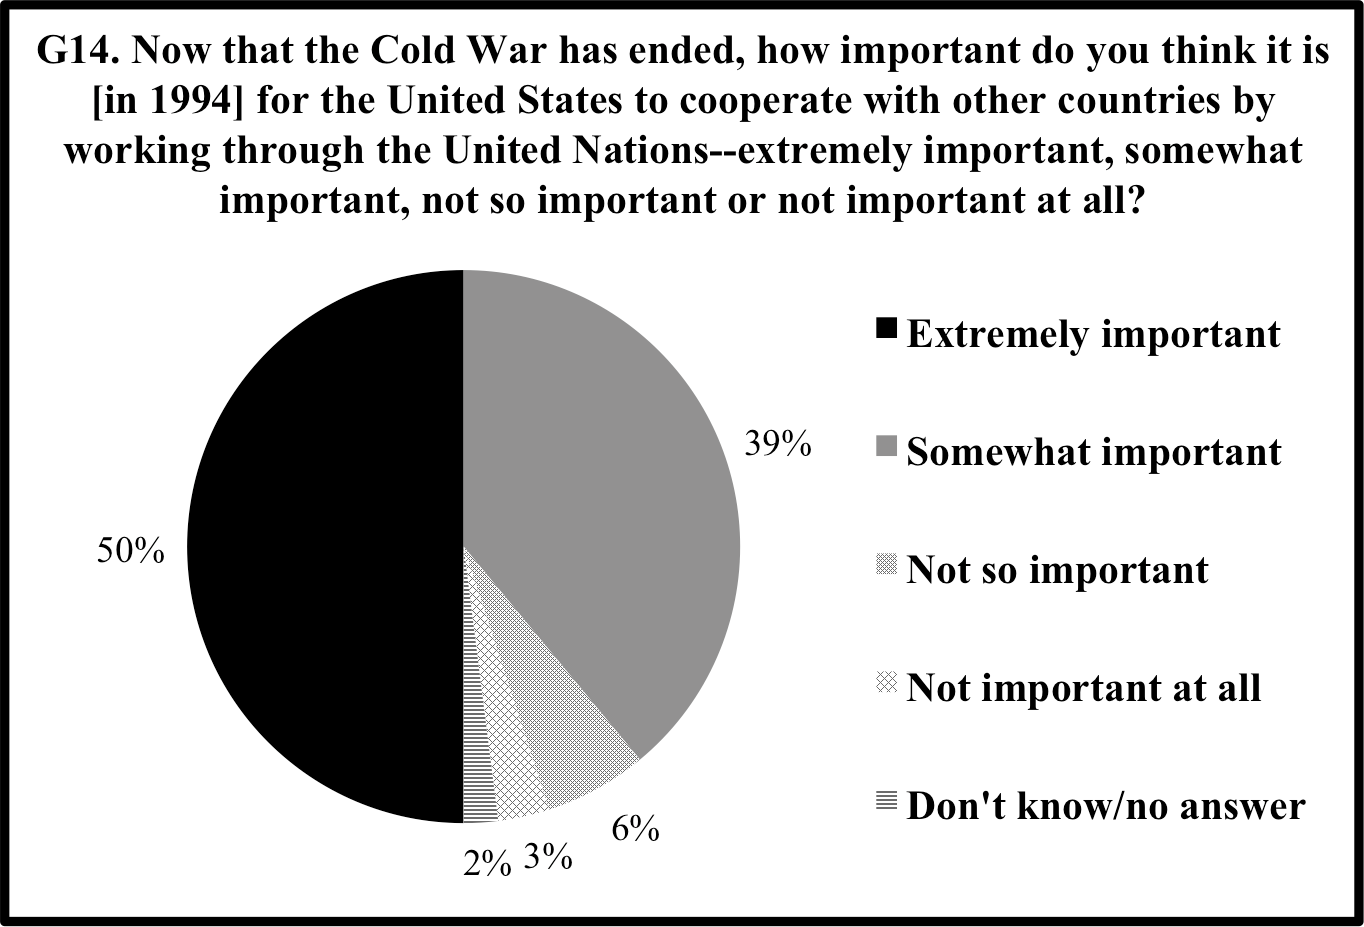
Source: CBS News/New York Times Poll data
Table 14
| Year | Extremely important | Somewhat important | Not so important | Not important at all | Don’t know/ no answer | Pollster/notes |
| 1994 | 50% | 39% | 6% | 3% | 2% | CBSNYT/National adult sample of 1107 |
[1] Press conference of 17 September, 1998.
[2] World Public Opinion (WPO), conclusion of 2006 and 2007 surveys by Chicago Council on Global Affairs and WPO.
[3] Barbara Crossette, ‘Darkest Hour at UN for Richest Deadbeat,’ New York Times, September 21, 1998.
[4] Luck, Edward C. Mixed Messages – American Politics and International Organizations, 1919-1999. Washington DC, Brookings Institution Press, 1999, pg. 265. Luck’s book reports of a website on which the results of the UNA-sponsored surveys can be found, but that website no longer exists. The present author has not been able to find the UNA-USA opinion polls report, but has found press reports and web materials, which are taken into account in this annex. Luck does not include the UNA-USA results in his book. In any case, the UNA-USA polling data cover only the decade immediately prior to issuance of Luck’s book and are therefore less useful than the Gallup Brain and Roper Center data for tracking purposes.
[5] http://www.worldpublicopinion.org/index.php, downloaded August 2, 1015.
[6] Hart Research Associates, UNF/BWC National Survey, Interview Schedule, April 2014.
[7] http://www.worldpublicopinion.org/index.php, downloaded August 2, 1015
[8] Japan Research Center, a member of Gallup International. http://www.nrc.co.jp/report/060927.html
[9] http://www.worldpublicopinion.org/index.php, downloaded August 2, 1015.
[10] http://www.worldpublicopinion.org/index.php, downloaded August 2, 1015.
[11] UNA-USA at UN press conference of 17 September, 1998.
[12] Asked of partial sample B, one quarter of telephone interviews, plus all in-person interviews (1/3 of sample)
[13] Note: This graph merges data with nuanced differences in the formulation of the ‘favorability’ question into two overall ‘favorable’ and ‘unfavorable’ categories.
[14] M: Categories of “very favorable/mostly favorable; very unfavorable/mostly unfavorable; Never heard of/don’t know /can’t rate”
S: Categories of “very favorable/somewhat favorable; very unfavorable/somewhat unfavorable; Never heard of/don’t know /can’t rate”
F: Categories of “very favorable/favorable; very unfavorable/unfavorable; Never heard of/don’t know /can’t rate”