
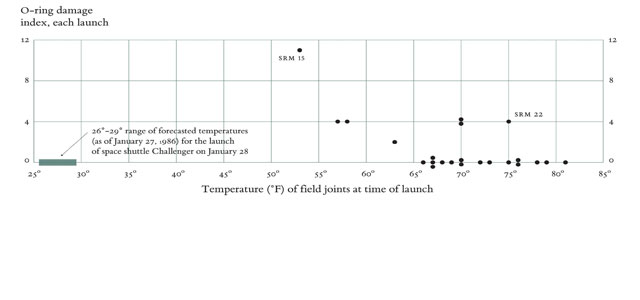
Depicting complex data to reveal clear implications.
Seeing is believing. Or is it? Take a look at the graphic below. See if all those little cartoon rockets vividly predict the increasing likelihood of the 1986 space shuttle disaster (as temperatures dropped) from failure of the Challenger’s O-rings.
Leave a Comment