Gregory Iannarella
Department of English
Developing Data Narrative Curriculum. A Theoretical Approach
What is Data Narrative?
Data Narrative is a field of study that concerns itself with the necessity of high-level story telling and rhetorical skills to meet increasingly complicated Data Analysis questions. It hopes to maximize information fluency by translating mathematical figures into the story of our lives.
It strives to bring meaning to the data we create and collect.
Why is this crucial to learning how to write?
Engaging with data fosters critical rhetorical skills. We expect our students to engage and work with primary sources, but don’t give them the tools to understand how primary sources are created. Because of this, students frequently write in a linear way. Whatever sources they find, they use, usually in blind agreement. There isn’t much recursive writing.
Recursivity
The goal of this project is to highlight the major benefits of incorporating data in writing instruction. The major benefit is creating a habit of recursion. That is, changing the trajectory of student writing from A-B, to a circular approach that’s open to change, critical thinking, and creativity to solve difficult problems and answer difficult questions within the constraints of real data.
The hope is that this gives students an intimacy with their source work, with the conversation in which they’re engaging, that will translate to an increased intimacy with their own writing.
Real Writing has a shape. That shape is Circular. To encourage and teach circular writing, we need to build a sandbox that mimics the work required to produce good writing.
DIY Primary Sources: Data Visualizations
A simple and easy way to allow students to create their own, legitimate primary source is by visualizing data. In fact, in many ways, raw data and its visualization is the purest primary source (with some caveats).
The curriculum should begin with some light instruction on data, with some preliminary writing that explains how it’s collected and chosen. This activity teaches students the frequently allusive skill of being source critical.
The best way to create this environment is with a sandbox.
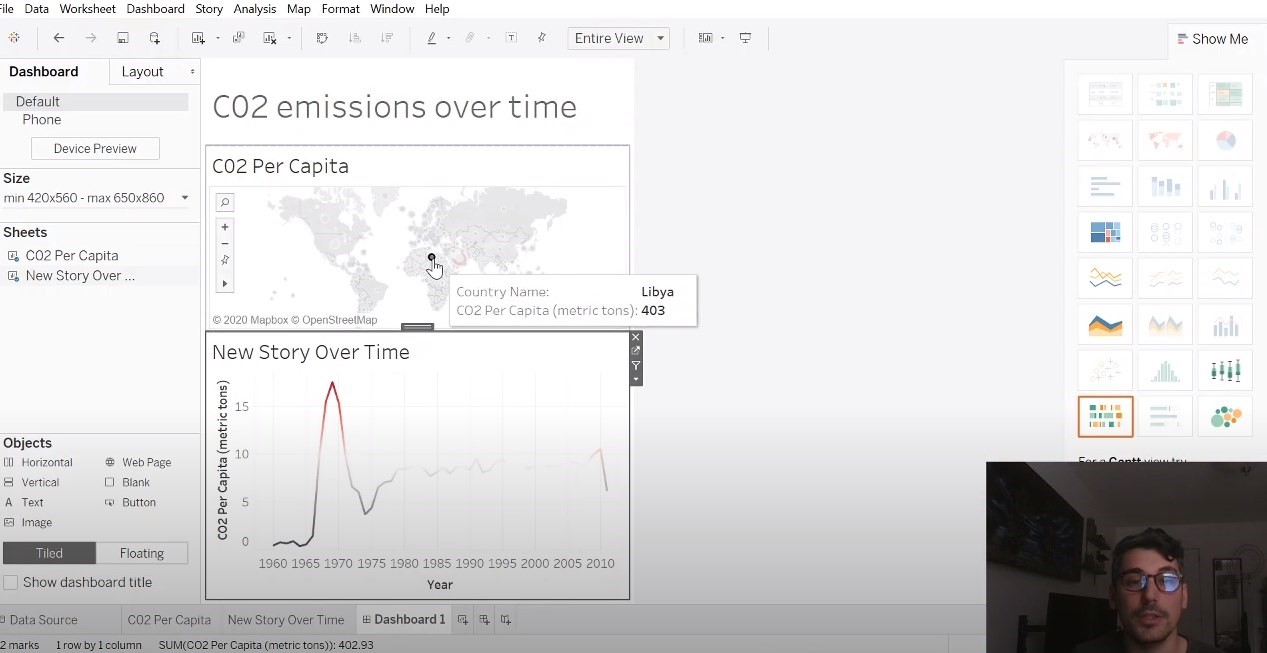
For this specific project, I was building off other research I’d done using Policy Map as the research sandbox. I wanted to see if, in one semester, we could achieve end-to-end data narrative training with students who had no experience with this genre of writing. The goal was that by the end of the course, they could use the industries most sophisticated software (tableau) to create interactive visualizations
In order to get there, I developed a sequence of 3 assignments which simultaneously instruct key rhetorical skills through the lens of data analysis. The results were promising.
Step 1: Basic interaction and Visual Analysis.
Translating the image.
Assignment 1
Writing Assignment 1: Emailed Insights Rough Draft
For this writing assignment, first, I want you to look through and explore the various articles in the “Writing in Context” Folder.
Choose one of the articles (or larger resources), and write a professional, persuasive email where you make a case for why you think this article, topic, set of visualizations, should be included in this course. The question is: How is this useful to learn Business Writing?
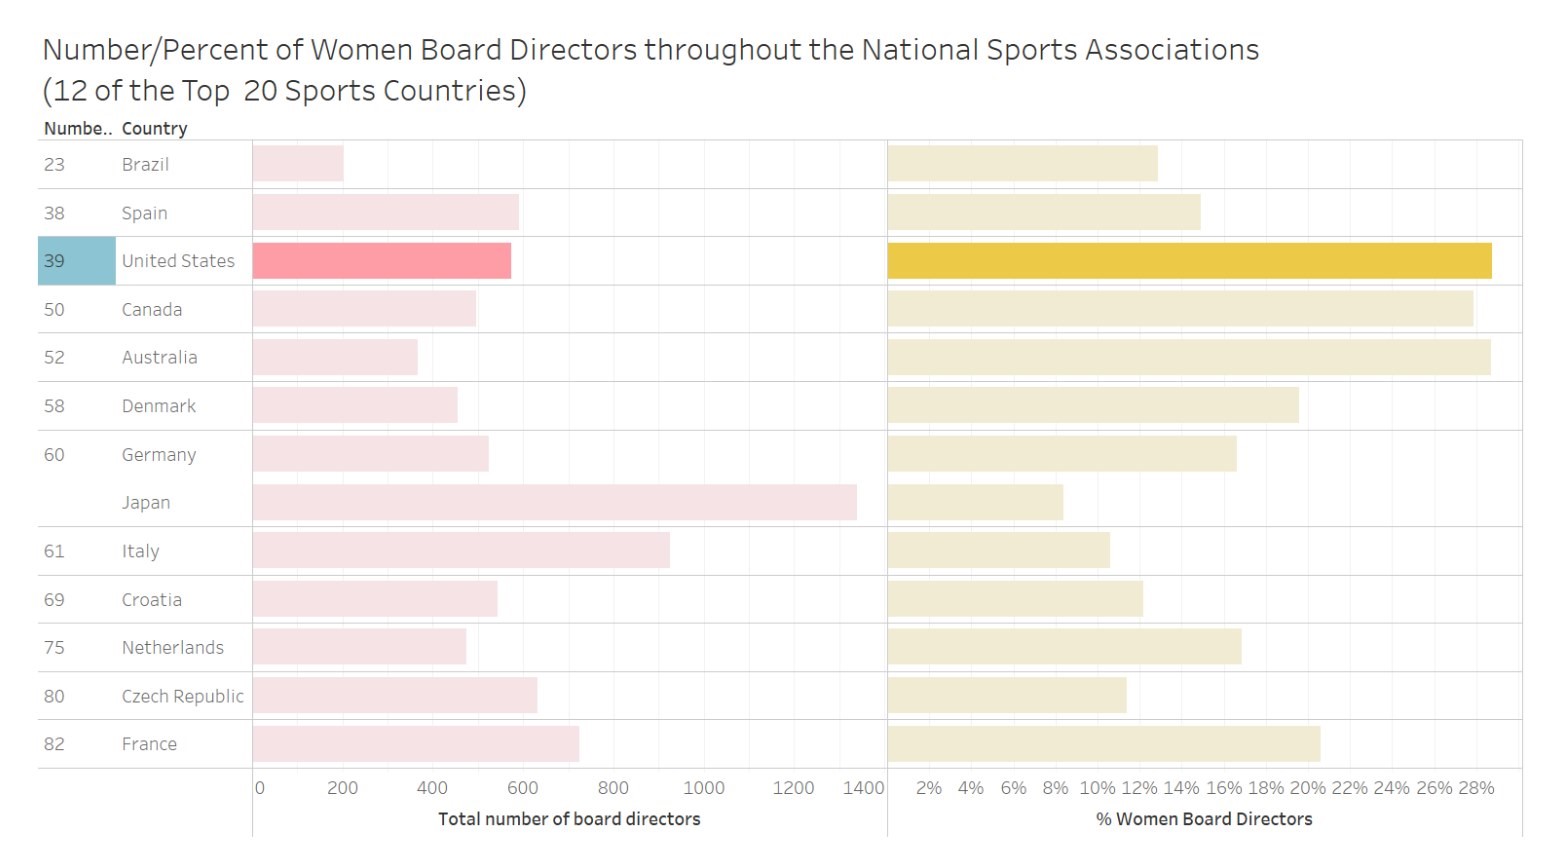
In order to do this, you should take screen shots of the visualizations and include them in the body of the email. Remember, you aren’t simply making a case for how interesting the topic is, but analyzing, investigating, and theorizing the urgency of the topic through the visualizations and other data.
You should include images as well as quotes from the text. For this assignment, no citation is necessary.
The email should be no longer than a page long. Think of it as a proposal that would lead to a longer meeting for discussion.
Learning Objectives:
At the end of this unit/module/week, students will be able to:
- Understand some basic building blocks of Rhetorical Theory
- Do some independent research on and formulating and executing targeted emails
- Sift through and choose Data Visualizations for desired topic
- Construct a professional email using Data Visualizations as an important source that balances informational writing
Lesson Organization
Assignment 2: Persuasive Essay using Policy Map
Essay Two: Research and Analysis: Narrative Data in Policy Map Rough Draft
3 Pages- double spaced- MLA Format
This assignment will challenge you to engage with an increasingly common activity in the workplace today: using software to wrangle, clean and visualize data. I can’t stress enough how important these skills will be in your career.
I ask that you write a formal, persuasive report using data visualizations that you create.
Please be advised, this assignment requires that you do a bit of experimenting in a piece of software.
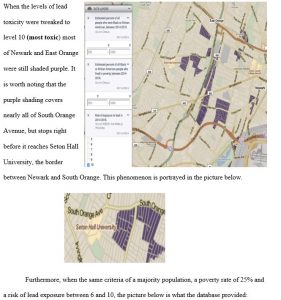
The piece of software we are using is called Policy Map. It is freely available to you through the Seton Hall Library. Policy Map allows you to use Census Data to visualize how specific data exists geographically. It also provides exploration options that can lay out demographic information of large and small regions.
Please see the video tutorial on how to use Policy Map.
This assignment requires that you to
- Build a three-layer map
- Set statistical parameters
- Design your document so visualizations are smoothly integrated into the larger narrative
- And want something: this is meant to be a persuasive writing assignment. You should be using the data to argue some point. (See student samples at end of document).
Learning Objectives:
At the end of this unit/module/week, students will be able to:
- Use Policy Map to research and visualize census data
- Practice writing about that data and using it to support a persuasive argument
- Better understand what it means to tell a story using data
The Three Layer Map: and why that’s important.
By forcing students to layer their own parameters in the sandbox, they’re asked to do far more sophisticated persuasive work than, say, writing a simple Marijuana should be legal essay (an incredibly popular topic.) Now, students layer local information and are forced to make the relationships make sense. They are asked to really explain how the parameter touch one another, and how these figures represent communities of people.
Assignment 3: Full scale research project in Tableau
Essay Four: Research Assignment (In a four part sequence)
Part 1 Pre-Writing: Develop research questions and gather data.
You can use any of the tools we’ve explored during the semester to investigate statistics and generate visualizations for use in your paper. Consider Policy Map or Excel’s explore options to do some exploratory writing on a topic of your interest.
Part 2 Analyze: 2 pages.
For this assignment, you will be drafting a PERSUASIVE message to the heads of an organization. A few things must be clear:
- The Organization you are writing to
- The Issue (Including all its details)
- Your proposed resolution.
This piece of writing should be short, totaling about two pages and should be composed as a formal email/letter. It should include some small research and statement of statistics proving your point. It should be concise, informational and directed towards your intended audience.
Students who have succeeded on this assignment have chosen topics they were already passionate about: Increased diversity at company xyz, healthier and more transparent food options at SHU, convincing company xyz to stop donating to certain initiatives or engaging in certain behaviors, setting up scholarships for specific social groups, etc.
It should be something you already think about. This will help you begin strongly with some sense of the topic.
Part 3 Writing Meta-cognitively: 1 Page
One of the most important skills you’ll learn in this class is Meta-Cognitive writing. That is, the ability to analyze and assess one’s own writing process and production.
Please answer the following to guide this Meta-Cognition:
How did you plan for composing this message? What types of research did you do? Did you try to consider the opposition? Did you consider why your point of view might not be feasible?
What steps did you take to improve the tone? What would you say is the tone of your message? How is this tone constructed to recognize the audience?
How is the message organized? Does it follow the tips on logical organization presented in chapter 3?
How is the document designed? Is there a way to improve clarity by changing this design? What options could you consider?
Part 4 Presentation
Pretend your letter was well received and the organization has requested a presentation on your findings. Take what you’ve found and create a Data Narrative in one of the presentation tools we’ve studied this semester. This could be a Sway, PowerPoint, Etc.
You will then record a video where you present these findings for the class.
Instruction: A Hands on Approach
Emphasize “Over the shoulder” learning. Where students watch and follow along. Remember, we’re really teaching them how to fish here.
